
1,500 square miles
Data visualization expert Hans Hack has developed two interactive mapping tools which are great if you need to explain the size of something by showing it on a map. His How Big tool uses scaled circles or squares to visualize simple area sizes and his Reprojector tool can be used to show the size of areas with more complex shapes.
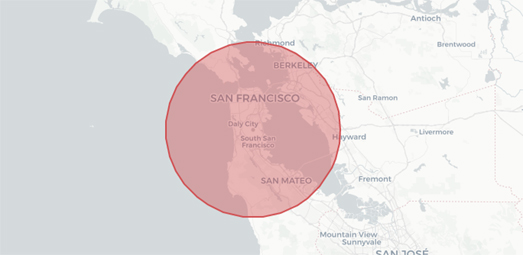
Massive swarms of locusts are currently destroying crops in Kenya, Ethiopia, Somalia, Tanzania and Uganda. The food supply of tens of millions of people is threatened by swarms as big as 1,500 square miles. Each swarm can include up to 150 million locusts per sq km. A single swarm can cover 120 miles in a day devouring all crops encountered on the way.
It can be hard to comprehend how large 1,500 square miles actually is. Which is why Hans Hack size comparison map tool can be very handy. How Big is an interactive map which allows you to show how large an area is by overlaying a circle or square of that size over any location. This allows you to make direct comparisons between the sized shape and places that you are familiar with.
Type in an area size into the How Big interactive map (in meters, hectares, kilometers or miles) and the map will display a circle or square of that size over the location of your choice. If you want to use the generated circle or square in your own maps you can even download a GeoJSON file of your sized shape.
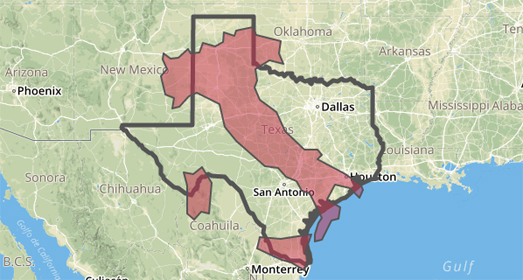
If you want to show the size of more complex shapes then Hans Hack can help you there as well. His Reprojector interactive mapping tool allows you to compare different areas with each other by moving GeoJSON shapes around. The tool is great for comparing two (or more) different geographic areas with each other.
The Reprojector tool allows you to upload any GeoJSON polygon onto an interactive map. This GeoJSON can be anything you want, including country or state borders. Once you have uploaded a polygon onto the Reprojector map you can move the shape around to overlay the polygon on any location in the world. When you are happy with the location of your polygon you can then download a GeoJSON file with the data to display your polygon in its new position.
You can see in the screenshot above an example where I positioned a GeoJSON polygon of Italy on top of the state of Texas. If you want to experiment with moving different country polygons around on the Reprojector map then you might find GeoJSON Maps of the Globe useful. This simple tool allows you to click on a country on an interactive map and then download it as a GeoJSON file (which you can then upload onto the Reprojector map).
No comments:
Post a Comment