
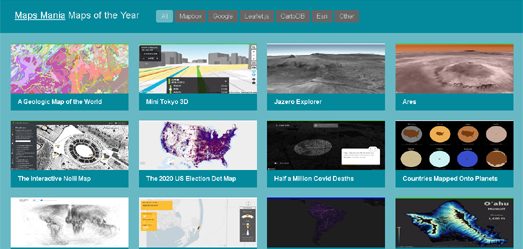
The Maps Mania round-up of the best Maps of the Year 2021 is out now!
Before you view this round-up of the 50 Best Maps of the Year I have a small disclaimer:
- There aren't 50 maps in this list.
- The maps listed are not the best maps of the last 12 months.
- Some of these maps probably weren't even released in 2021.
The Maps of the Year 2021 could more accurately be described as 'a collection of the 48 interactive maps which made the biggest impression on me during the last 12 months'.

If I was forced to pick one interactive map which made the biggest impact in 2021 I would probably choose Sam Learner's River Runner. River Runner is a very clever map which uses U.S. watershed data to calculate the route that a drop of rain would take from any location in the United States to the ocean. The map uses Mapbox's elevation data and the USGS's national hydrology data to animate the incredible journey of a single drop of water to the sea.
Although River Runner might be my personal pick for Map of the Year it wasn't the most popular map on Maps Mania in 2021. That award goes to the Magic Mushroom Map. I probably wouldn't pick this map as one of my favorite maps of the year but for some reason the Maps Mania post on the Magic Mushroom Map was by far the most read on this blog during the past year. For some reason (especially in the Fall) a lot of people were interested in exploring a map which shows where and when magic mushrooms are in season near their homes.
My Maps of the Year 2021 list allows you to filter the interactive maps displayed by the map library used to create each map (Mapbox, Google Maps, Esri, Leaflet and Other). When I first used this filter on my Maps of the Year list in 2014 a small majority of maps were created using the Google Maps API. This year only one map in my Maps of the Year list was created using the Google Maps API (Moving Hamburg). The fact that the vast majority of the interactive maps in this year's Maps of the Year list were created on the Mapbox GL platform is obviously a reflection of the dramatic shift in the use and influence of these two mapping platforms in the last few years.

This year's list also includes a significant number of maps made by 'Other' mapping libraries. Among these are a number of very impressive animated 3D maps / models which were created by online news websites to illustrate important stories. These include:
- What the Tulsa Race Massacre Destroyed
- Attacks of 11 September 2001
- Singapore 2030
- How Tati made her mark in Barbès
To this list I could have probably added a number of other 3D animated maps created by the New York Times (however those maps are all hidden away behind a paywall).
If I've failed to link to your favorite interactive map of 2021 feel free to berate me in the comments below and leave a link to your favorite map(s).
No comments:
Post a Comment