
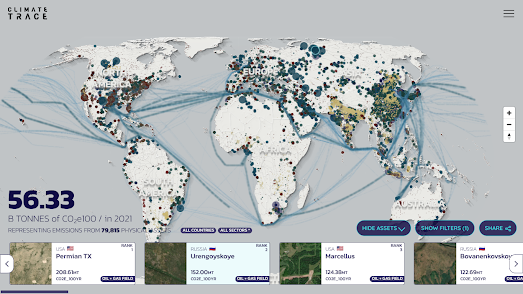
A new interactive map from Climate TRACE identifies, tracks, and monitors sources of greenhouse emissions around the globe. The map allows anyone to discover and monitor the 79,000 highest emitting greenhouse gas sources in the world.
The Climate TRACE Emissions Map uses scaled map markers to show the locations of facilities around the world emitting greenhouse gases and to show the level of gases emitted. The map also allows you to explore the levels of greenhouse gases emitted by individual countries and industrial sectors. The data from the map comes from an analysis of satellite imagery and from self-reported emissions data.
According to Climate TRACE the new map shows that self-reported data by countries and industries does not reflect the true levels of greenhouse gas emissions around the world. For example last year " the actual emissions from global oil and gas production collectively were around double what was self-reported to the UN in 2020."
The interactive map includes a number of controls which allow you to filter the information shown on the map. You can filter the map to show individual countries, individual sectors of industry and different types of greenhouse gas emissions. For example you can filter the map to show only the highest emitters of carbon dioxide in the United States. Doing this reveals that the Permian oil & gas field in Texas is the highest polluter of CO2 in the U.S. In 2021 it emitted nearly 71 mt of CO2, which was almost double the amount of CO2 emitted by the third highest polluter of CO2 in the USA.
The third highest source of CO2 in the USA was the motor vehicles of Los Angeles (36.47 mt CO2). In comparison motor vehicles in London, a city with over double the population of LA, emitted 4.43 mt of CO2.
No comments:
Post a Comment