

The US Department of Transportation has released a series of interactive maps to visualize the impact of motor vehicle deaths on communities across the United States. In Our Nations's Roadway Safety Crisis you can view a heat map of fatal crashes, a map of county roadway fatalities compared to the national average, a map comparing fatality rates and population size, and a map showing the distribution of fatalities in disadvantaged communties.
In recent years the 30 year decline in roadway fatalities has stalled. In fact the number of fatalities on the country's roads actually increased in 2020 and 2021. In response the U.S. Department of Transportation has launched the National Roadway Safety Strategy in order to address the number of serious and fatal injuries on US roads. The maps in Our Nation's Roadway Safety Crisis help to identify where roadway fatalities occur on the nation's roads.
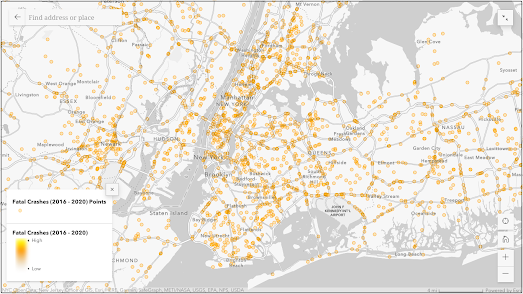
The Hot Spots of Fatal Crashes map shows a heat map of roadway fatalities over the last five years. If you zoom in on your town on this map you can view the locations of all the local roadway fatalities over the same period. Click on a roadway fatality marker on the map and you can view details of the crash (including date, time, day of week, number of vehicles involved and the number of fatalities.
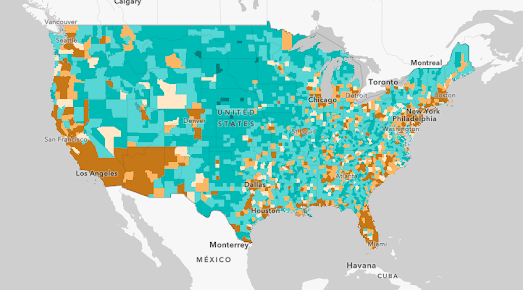
The Concentration of Roadway Fatalities map visualizes the number of roadway fatalities in each county compared to the national average. On this map individual counties are colored to show if they had higher or lower fatalities than the national average. Brown counties had higher than average and blue counties had lower than average.
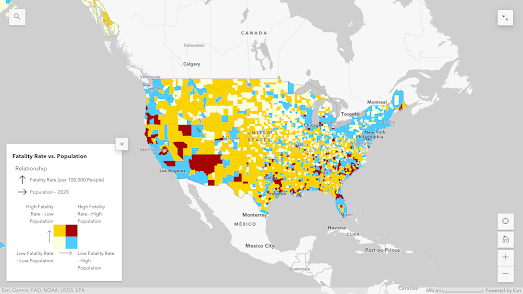
Obviously some counties have much larger populations than other counties which may have a significant impact on the number of road fatalities in that county. The Fatality Rate vs. Population map allows you to compare the levels of road fatalities in relationship to local population levels. On this map counties with a low population and high road fatality rate are shown in yellow. The counties colored blue have a high population and low fatality rate.
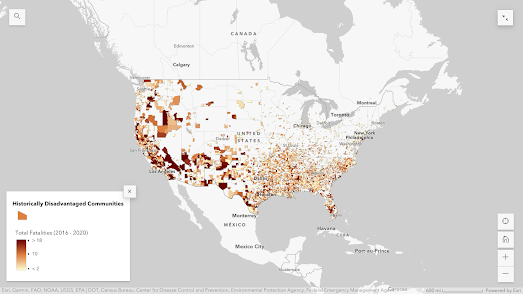
43% of the communities with the highest roadway fatalities are historically disadvantaged. The Exploring Fatalities and Equity map visualizes the levels of roadway fatalities in 16,514 disadvantaged census tracts. The darker the color of the tract on this map then the higher the number of roadway fatalities.
No comments:
Post a Comment