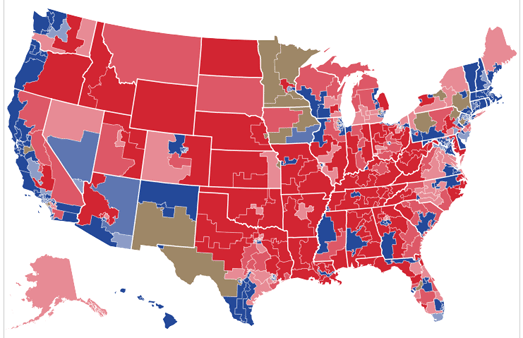
The 2018 Midterm Elections are now only half a year away. G. Elliott Morris of the Crosstab has released his forecast map for the 2018 midterm elections to the House of Representatives. Crosstab's forecast is based on an average of opinion polls, a forecast of the polls on polling day and simulations of the election.
The 2018 Midterm Elections Forecast interactive election map shows the chance each House seat has of being won by either the Republicans or Democrats. The map also highlights all the seats that the Crosstab forecast predicts will flip in the election. If you hover over a seat on the map you can view the chance of winning that each party has in the seat using Crosstab's forecast.

If you don't like the results shown on the map then

No comments:
Post a Comment