Showing posts with label China. Show all posts

Saturday, August 09, 2025

Ghost Signs: Phantoms of the Past

Ghost signs are the fading painted advertisements that you often see on old brick walls and buildings. They're a window into a city's history, hinting at businesses that have long since disappeared. You can find these signs on the sides of buildings, above doorways, and in alleys - silent reminders of a past that still peeks through into our modern lives.

The HK Ghost Signs map is an historical archive of Hong Kong's ghost signs. The map itself has a striking visual style, with a black-and-white base map hinting at a vintage aesthetic - punctuated by bright pink markers highlighting the city's surviving ghost signs. Clicking on a marker on the map reveals a photograph and often some background information about the selected ghost sign’s origins.

Many of the mapped signs on HK Ghost Signs once belonged to shops and businesses that closed decades ago - their painted names and slogans surviving only as faint traces on stucco and brick. Collectively, these points form an alternative tour of the city, one that winds not along the main tourist routes, but through backstreets and forgotten facades. The map even includes 'star' and 'check-in' options for each mapped ghost sign, that make it very easy to create an itinery of signs you might want to visit and also the means to tick-off the signs once visited.

At the other end of the stylistic spectrum is the San Francisco Ghost Sign Mapping Project, which uses a straightforward Google My Map to plot nearly a thousand ghost signs across the Californian city. 

While its visual presentation is less polished than HK Ghost Signs, the project makes up for it with functionality. A handy menu lets you filter the map to show only certain types of signs, such as Building/Business signs or Ad/Brand signs. This makes it easy to focus on just one particular slice of the city’s painted history at a time.

Unrelated to ghost signs (but lovely nonetheless) - M+, Hong Kong’s museum for visual culture, has an interactive map of Neon Signs that are also dotted around the Chinese city. Bookmark both Hong Kong maps, and you may be able to find faded ghost signs sharing the same walls with neon - providing a striking clash of past and present in the same city space.

Thursday, May 29, 2025

Belt & Road vs TACO

In 2013, China launched its Belt and Road Initiative (BRI) to boost trade with the rest of the world. Today, China is the world’s largest trading nation.

A key component of the BRI has been major investments in strategic overseas ports and airports. The Council on Foreign Relations has tracked these developments through two interactive maps:

These maps highlight the global reach of China’s infrastructure investments, showing the locations of ports and airports with Chinese investment or partial ownership. In total, 129 ports worldwide now have some degree of Chinese ownership, and 46 airports have received Chinese investment.

China’s overseas port and airport investments reflect the broader ambition of the Belt and Road Initiative - to reshape global infrastructure in ways that advance both its economic and strategic objectives. While these projects can bring development opportunities, they also raise important concerns about ownership, sovereignty, and influence. The Council on Foreign Relations’ maps reflect these complexities, particularly through assessing each port's suitability for use by the Chinese military.

While China expands its global reach through the Belt and Road Initiative, the United States’ trade policy has taken a more erratic turn. Some Wall Street traders have dubbed it “TACO”,  short for “Trump Always Chickens Out”, a reference to the pattern of aggressive tariffs being announced, only to be walked back or removed shortly afterward. This inconsistency stands in stark contrast to the long-term infrastructure strategy China is pursuing.

Thursday, April 03, 2025

Donald Trump Surrenders the World to China

The China Index is an interactive map that ranks the expanding influence of the People’s Republic of China (PRC) across the globe. Using 99 distinct indicators - from media sponsorships to academic partnerships - the index tracks Beijing’s deepening reach, updated annually to highlight its accelerating dominance.

The map ranks countries around the world based on how much they are under the sway of Chinese influence. According to the Index currently China has the most influence on Pakistan, Cambodia and Singapore. However China’s strategic investments and partnerships are reshaping political and economic alliances around the whole world, at a time when the United States is becoming more isolationist and, under Donald Trump, imposing trading restrictions on its economic partners.

The Lowy Institute’s trade map starkly illustrates the seismic shift in the global influence of China and the USA. The map shows that 70% of countries now trade more with China than with the U.S. - a dramatic reversal from 2000, when over 80% relied on American markets. Trump’s aggressive new tariffs, rather than reasserting U.S. economic leadership, risk accelerating America’s decline as a preferred trade partner. With half the world already trading twice as much with China, Washington’s protectionist turn will only cement Beijing’s advantage.

In terms of exports, the United States remains a larger export destination than China for more than half of all economies. However, given Donald Trump’s 'Liberation Day' tariffs, the United States' is quickly losing its appeal as an export destination. At the very same time Trump's economic policy has very few ideas as to how the United States' will increase its own exports. In fact there are growing movements abroad to boycott American products and service in response to Trump's tariffs.

The Global Influence Index further confirms China’s ascendancy. While the U.S. clings to historical ties in Europe - now jeopardized by Trump’s 20% tariffs on the EU - China is making decisive gains across Africa, Asia, and Latin America. Beijing’s "sustained and deliberate engagement" has turned entire regions toward its orbit, visualized in the GII’s vivid red dominance.

Together, these maps reveal an irreversible trend: China is eclipsing the U.S. as the world’s preeminent economic power. As America retreats behind tariffs and isolation, Beijing’s calculated global strategy is rewriting the rules of influence - and Donald Trump is keen to help them.

Thursday, January 30, 2025

The USA is Closing for Business

animated map with countries colored each year to show whether the USA or China was the larger trading partner. From 2000-2003 countries around the world turn red from blue as China becomes the world's dominant economic force

This animated map from the Lowy Institute shows whether the USA or China was the larger trading partner for countries around the world each year this century (up to 2023). The map provides a stark visualization of the economic shift away from the United States and toward China in the 21st century.

According to the Lowy Institute, around "70 per cent of economies trade more with China than they do with America, and more than half of all economies now trade twice as much with China compared to the United States." At the beginning of this century the situation was very different, when more than 80 percent of countries traded more with the USA than with China.

The map allows users to view the largest trading partner for each country (limited to China and the United States) in terms of two-way trade, imports, or exports. In terms of exports, the United States remains a larger export destination than China for more than half of all economies. However, given Donald Trump’s constant threats to impose tariffs on other countries, it is evident that he aims to weaken the United States' appeal as an export destination. What is less clear is how he plans to increase the United States' own exports.

Saturday, September 07, 2024

China vs America - World Influence Map

The Global Influence Index (GII) shows the influence of the United States and China on 191 countries around the world based on 28 different economic, security, and political criteria. Using the GII's new 3D globe you can tell at a glance where in the world either the U.S. or China has the greatest influence.

Individual countries on the GII globe are colored to show whether they are aligned more with China or the U.S. (green being U.S. aligned and red being aligned with China). If you select the 'stories' button you can view a number of guided tours of the influence that China and the United States hold in different regions of the world (including Africa, the Middle East, Europe, Latin America and the Indo-Pacific).

According to the GII currently the United States holds sway in Europe. This is based partly on the strong historical ties between Europe and the U.S. but also on Europe's growing concerns over the strategic threat posed by China. In many other regions of the world, for example in Africa, the U.S. is losing the influence battle to China. According to the GII China has pursued 'sustained and deliberate engagement with nations throughout Africa', which is reflected in its growing influence in the region.

According to the GII the 'Indo-Pacific is the epicenter of strategic competition between the United States and China'. Australia, India, South Korea and Japan retain very strong economic and strategic ties with the United States. However many other countries in the region are developing very strong ties with China.

A full breakdown of the variables and methodology used to determine the influence scores of each individual county are available on the about section of the GII website.

Friday, January 12, 2024

Reconstructing the Ancient Trade Routes

Voyage with a Tail Wind: Chronicles of Ancient Maritime Journeys uses an ancient 15th Century book to reconstruct the trade routes used by Chinese spice traders during the Ming Dynasty. The Voyage with a Tail Wind or Shun Feng Xiang Song is a Chinese manuscript, dating from around 1403, which documents the maritime routes, coastal landmarks, and navigational hazards encountered by Chinese sailors navigating the western seas and Indian Ocean.

This story-map animates a journey from China to Indonesia based on the accounts of the sailors retold in Voyage with a Tail Wind. The book records the names of islands visited (or passed) by Chinese sailors on their voyages. This story-map recreates one of these journeys, the 38 day voyage from Wu Yu (modern day Wuyu Island) To Kupang (in modern day Indonesia).

As you scroll through Voyage with a Tail Wind you can follow the journey of a Chinese trade ship as it sails to Indonesia. As you scroll the ship moves on the map while an information window provides a continually updated record of the number of miles traveled. At the bottom of the map a heads up display keeps track of the ship's speed, miles traveled and the amount of time spent on the journey.

As you journey towards Indonesia scrolling info windows use data from the 'Voyage with a Tail Wind' book to provide information on the sights and visual aides used by the sailors to successfully navigate as they journey towards their destination of Kupang.

Thursday, December 21, 2023

The Battle of Hong Kong

On the same morning that the Japanese attacked Pearl Harbor (Sunday, December 7, 19411) they also attacked the British Crown colony of Hong Kong. The Hong Kong garrison (consisting of British, Indian and Canadian units, the Auxiliary Defence Units and Hong Kong Volunteer Defence Corps) managed to hold out for over two weeks. However on Christmas Day 1941 the colony finally surrendered to the Japanese.

Project’44 has created a number of maps which document the Battle of Hong Kong, with an emphasis on the involvement of the Canadian troops defense of the British colony. The Fall of Hong Kong includes a story map which provides a detailed chronology of the fall of Hong Kong to the Japanese.

As you scroll through Project '44's story map you can follow the progress of the battle on an interactive map of Hong Kong. The map sidebar provides a narrated history of the battle, illustrated with photos and videos from the Battle of Hong Kong, while the interactive map automatically pans and zooms to highlight the locations mentioned in the narrated tour.


The Battle of Hong Kong 1941 is another interactive map which recounts the spatial and chronological history of the Japanese capture of Hong Kong in the Second World War. The map is the work of the History Department at the Hong Kong Baptist University. The map itself provides both a spatial and temporal account of the Battle of Hong Kong. The map's timeline contains 51 different time-steps. This timeline allows you to follow the progress of the battle during the eighteen days it took the Japanese to take Hong Kong, showing the changing positions of platoon/squad/individual artillery pieces over the whole course of the Japanese invasion.

The map also includes a 'Faces of War' layer. This map layer provides a number of short biographies on some of the key participants in the Battle of Hong Kong. As a result of the battle over a thousand Allied lives were lost and over a thousand were reported missing. It is believed that casualties on the Japanese side were at least as high. 

After the Battle the Japanese remained in Hong Kong for three and half years. During that occupation it is estimated that at least 10,000 Hong Kong civilians were executed. Resistance groups of Cantonese and Han Chinese continued fighting until the end of the Japanese occupation. On August 15th, 1945, Japan officially surrendered and on the 30th August the British army returned to Hong Kong. 

The Japanese occupation of Hong Kong lasted for three years and eight months.

1. The invasion of Hong Kong actually began on the 8th of December, however this is due to the effect of the International Dateline, it was in reality on the same actual solar day as the 7th December attack on Pearl Harbor.

Monday, July 17, 2023

The World in Hong Kong

You can walk from Zurich to Rome in just over 1 hour. That is 'Zurich Avenue' and 'Crescendo Roma Viale' in Hong Kong (according to Google Maps it will take you 195 hours to walk from Zurich, Switzerland to Rome, Italy).

Rome and Zurich are not the only world locations which feature in the street names of Hong Kong. According to Asia’s World City: Around the World in One Day through Hong Kong's Street Names there are hundreds of locations in Hong Kong named for overseas locations. In this exploration of Hong Kong's street names designer Diana Pang has taken a deep dive into the history of Hong Kong's streets.

As a former British colony you will probably not be surprised to learn that lots of locations in Hong Kong are named after places in the UK. Hong Kong's historical importance as a major trading hub has also had an impact on many of the city's street names. Hong Kong's close trading ties in the 19th century with Indochina, can still be observed in street names which reference towns in Vietnam, Malaysia, Taiwan and Japan.

You can explore the influence of world geography on Hong Kong's streets in two interactive maps in Diana's article. One map uses polylines to connect Hong Streets to their namesake origins around the world. The other map uses colored dots to show all of the Hong Streets named for overseas locations, with the color of the dots representing different countries. Click on a marker on the map and you can learn a little more about that individual street's etymology.

Thursday, December 22, 2022

Mapping the Ancient Silk Route

The China National Silk Museum has created an interactive map which plots the technological advances in silk production over a period of around 6000 years. The Jinshow World Silk Interactive Map is the pilot project of a planned Interactive Atlas of Silk Roads. The initial world silk map plots the locations of over 12,000 artefacts related to the technological evolution of the production of silk and allows users to explore the development of materials and techniques in silk production over 6,000 years history.

The main Jinshow World Silk Map shows where archeological artefacts related to the production of silk have been discovered. These artefacts may be related to the developing technologies used in the production of materials, dyes and fibers. The map includes an interactive timeline which allows you to filter the archaeological discoveries by date.

The Jinshow World Silk Map also includes a number of maps exploring the Spatio-Temporal Evolution of silk production. This consists of four separate maps which plot the evolution of 'fibers', the 'primitive loom', the 'treadle loom' and 'dye'. These four maps all include a timeline navigation control which you can use to view the chronological development of these four separate areas of silk production.

Saturday, December 17, 2022

Scrolling the Mekong River

Reuters has created a very impressive scrollytelling map which is being used to illustrate how dams are having a devastating impact on the farms and livelihoods of people living on the Mekong River Delta. 

In How Dams Starve the Mekong River of Vital Sediment Reuters explores how the construction of hydroelectric dams has blocked the flow of sediment in the Mekong River. Sediment which is needed to provide nutrients for the rice farms along the delta. These rice farms help to feed up to 200 million people across Asia.

An impressive scrollytelling map is used to show the location of operational dams and the dams which are planned to be built in the future. As you scroll through the article the map scrolls down the Mekong River, while small info windows provide information on the hydroelectric dams and their devastating impact on those who rely on the river and its floodplains for their livelihoods. 

As you scroll along the river you travel from Tibet, through China, Laos, Thailand, Cambodia, and Vietnam to the South China Sea. Because of the Chinese-built hydroelectric dams only about two-thirds of the silt which once flowed into the Mekong River Delta is now arriving. In 2007 around 143 million tonnes of sediment reached the delta. It is estimated that at the current rate of decline less than 5 million tonnes will reach the delta annually by 2040. 

Thursday, November 04, 2021

America Votes to Drown Florida

China and the United States have refused to sign up to halting new coal production. At the COP26 climate summit 40 countries from around the world have agreed to halt all investment in new coal power generation. Coal is the biggest contributor to global heating. By refusing to agree to move away from coal power China and the USA have effectively decided to condemn the whole world to irreversible climate change. 

Here is what that decision will mean for U.S. and Chinese cities:

New Orleans

Rising sea levels will result in New Orleans becoming an island in the Gulf Coast. The central districts of the city may avoid being submerged but the rest of New Orleans will be lost to the sea. All that will remain of New Orleans is a small island effectively cut-off from the U.S. mainland. 

Miami

At least some of New Orleans will remain above water. Sea level rise will mean that all of southern Florida, including Miami and the Everglades, will sit at the bottom of the ocean. 

New York

Rising seas will also drown much of New York. Manhattan's famous skyline will probably become even more dramatic, as the city's imposing skyscrapers will now emerge out of the significantly enlarged Hudson and East Rivers.

Hong Kong

A water level of 9.6 meters above the high tide line would result in huge areas of Hong Kong lying below the water line. The Yau Tsim Mong and Kowloon City districts will be almost completely submerged and all other coastal districts will face major flooding.

Shanghai

Shanghai will not be so lucky. All of the land alongside the Yangtze Estuary will be submerged by rising seas. The entire 26.32 million people currently living in Shanghai will have to move somewhere inland. As will the 10.72 million living in Suzhou, the 3 million people living in Nantong, Changzhou's 12,400,000 population and the 3.5 million in Wuxi.


These maps were all taken from Climate Central's Coastal Risk Screening Tool. This interactive map allows you to see which areas around the world are most threatened by sea level rise and coastal flooding. The map uses coastal elevation data with the latest projections for future flood levels to model how rising seas will impact coastal communities. 

The sea level projections used in Climate Central's model are taken from the UN's IPCC 6th Assessment Report (AR6). You can view the report's sea level projection data on NASA's interactive map, the NASA Sea Level Projection Tool.

Thursday, May 27, 2021

Where the Mountain Meets the River

Jack Zhao has been Mapping Where the Mountain Mets the River in East Asia. By mapping only place-names which contain the characters for mountain (山) and river (水 or 川) in East Asia Jack is able to explore how closely these geographically associated place-names actually reflect the local geography.

As well as being words in their own right the mountain (山) and river (水 or 川) characters also appear as building blocks in other words with related but unique meanings. For example the character for ‘harbor’ (港) contains the radical for water. This can be seen in the name Hong Kong (香港, fragrant harbor).

Jack has created a series of maps on which place-names are reduced to just the radicals for mountain and water. These are shown on top of a terrain map. There are some obvious patterns which we would expect to see in these maps. For example on the map above (mountain radicals shown in black, water radicals shown in white) we can clearly see lots of white related place-names around the coast. The mountain place-names (in black) mostly seem to be concentrated in areas with high elevations (as we might expect).


By mapping the root radicals for water and mountain Jack's map doesn't reveal the regional differences in the names for these geographical features in East Asia (I don't know if there actually are any). For example in America the navigable passages between mountains in the USA have lots of different names. Some are called 'passes', others are called 'gaps' and some are even called 'notches', or 'saddles'. 

A few years ago Esri's John Nelson undertook a similar mapping project to Jack Zhao's, except in John's case he mapped out place-names in America which contained the word 'pass', 'gap', notch' or 'saddle' in order to see if there are any regional variation in the use of these names for navigable valleys.The results can be explored in his Gap, Pass, Notch and Saddle story map.

To examine the regional variations in the words given to navigable valleys in the USA Nelson downloaded and mapped every named place from the U.S. Board of Geographic Names. The result is a fascinating map of 2.3 million place-names in America. As you scroll through the Gap, Pass, Notch and Saddle story map you are shown how place-names in the USA concentrate where humans settle along coastlines, along transportation routes and in major conurbations.

As you progress further though the Gap, Pass, Notch and Saddle story map the non-valley place-names are removed from the map. The different navigable passage place-names are then each given a different color. The result is a map which clearly reveals the regional variations in how these passages are named throughout the USA.

Monday, May 10, 2021

The Building Heights of Beijing

Wendy Shijia has created an interesting building height map of Beijing. Wendy's The Height of Central Beijing colors individual buildings in the Chinese capital based on the number of levels they have.

Unlike many other cities around the world Central Beijing actually has shorter buildings in its center, with its taller buildings concentrated outside of the city center. This is mainly because the map is centered on Beijing's historic Forbidden City, which dates back to the Ming Dynasty, and which was built long before the current craze for ultra tall buildings. 

Another interesting visualization which allows you to explore city building height data is the Rendering OSM Objects in Mapbox GL interactive map. This map includes a dynamic histogram which tells you how many buildings of each height there are within the current map view.


Drag this map around and the histogram will automatically update to show you the number of buildings of different heights in the map view. A small inset map also provides a 3D view of all the shown buildings which provides a neat overview of where the buildings of different heights are actually situated.

There are many reasons why you might want to show the number of buildings by height in a defined area. For example, many residents in my neighborhood are currently fighting a planning application for the development of a tall block of apartments. This map could be used to show the current number of local buildings of different building heights. It could help to highlight how a taller building would look very out of place in a neighborhood which is predominantly constructed of much shorter buildings.

Friday, March 26, 2021

The Interactive Mao Kun Map

The Mao Kun map is the earliest Chinese map to accurately map Southern Asia, Persia, Arabia and East Africa. The map was first published in the 17th century in the military treatise Wubei Zhi. The introduction to the map in Wubei Zhi suggests that the Mao Kun charts are based on documents from the expeditions of Zheng He, suggesting that the map dates back to at least the 15th Century. 

The Mao Kun map is also sometimes known as Zheng He's Navigation Map. The map is a long strip map charting the sea route from the Ming capital in Nanjing to the East Coast of Africa (the map is arranged from right to left, starting from Nanjing and finishing in Hormuz.).

The Mao Kun Explorer is a fantastic interactive map which displays and synchronizes the 17th Century Mao Kun strip map with a modern day map of the world. The original map contains over a hundred place-name labels. These labels have been made interactive on the Mao Kun Explorer. Click on one of these Chinese place-name labels on the Mao Kun map and you will be shown the location on the modern map. A small information window will also translate the Chinese place-name label into English.

Superimposed on top of the Mao Kun map is a small inset map which allows you to view the modern day countries that the Zheng He expeditions passed through. Click on this inset map and both the modern map and the Mao Kun map will pan to the selected country.


The Mao Kun Explorer was inspired by Professor Anthony Barbieri's Interactive Zheng He Sailing Map. This interactive version of the map was created by Professor Barbieri of the University of California, Santa Barbara. His map also includes translations of the Chinese place-names on the original Mao Kun map. 

If you hover over the place-names (highlighted in red on the map) you can read the English translation. If you click on a highlighted place-name you can view the selected location on Google Maps. All these translated and mapped locations are also available from a drop-down menu, which provides a quick way to find a location on the map. A small inset map runs along the top of the map to show where you are currently looking on the huge strip map.

The dotted lines on the Mao Kun map are sailing routes. The Chinese text along these routes provide sailing instructions, including compass points and distances. The sailing instructions are more detailed in the Chinese waters, presumably because the cartographer had a greater knowledge of these. The map as a whole is also more accurate in Chinese territory and becomes less complete the further west it goes.

Tuesday, February 16, 2021

A Quiet Chinese New Year


Last Friday (12th Feb) was Chinese New Year. In a normal year around 2.8 million trips would have been made by Chinese people traveling to visit and stay with relatives over the Spring Festival holiday. During this year's Spring Festival, because of the Covid-19 pandemic, travel in China was down by at least 50% on last year.

Thanks to Baidu maps we are able to see when, where and how Chinese people travel during the Spring Festival. Baidu's mobile map application has over 350 million active users and receives over 10 billion location requests every day. This provides Baidu with a unique insight into the movements of the Chinese population over the Spring Festival.

Every year Baidu releases its Qianxi (migration) visualization. This interactive map allows you to explore which national highways were the most congested over the Chinese New Year Spring Festival. It also allows you to visualize the movements to and from China's largest cities over the holiday period. This year the number of people making city to city journeys during the Spring Festival dropped by 50% compared with last year. Ten provinces, including Heilongjiang, Beijing, Jilin, Hebei, Tianjin, Shanghai, Chongqing, Zhejiang, Liaoning, and Jiangsu, saw a decline in travel exceeding 55%.

With many people not traveling to spend time with their families this year Baidu has also seen an uptick in the number of visitors to local outside attractions. In Beijing the Summer Palace, Temple of Heaven Park and Beijing Zoo saw a significant increase in visitors during the Spring Festival. In Shanghai the Chenghuang Temple, the Bund, and the Oriental Pearl Tower also saw a large increase of visitors during this year's holiday.

Tuesday, October 06, 2020

Chinese Acquisitions in Europe


Over the last year there has been a lot of  speculation about the security threat posed by Chinese technology companies such as Huwei and Tik-Tok.

Huwei's role in telecoms networks around the world has led to a major worry about how much information the company passes on to the Chinese government. Similar concerns have been raised about the use of Tik-Tok and how much personal user data can be accessed by Beijing. Both companies claim that they pose no security risks to their users but many western governments doubt that either company has any power to refuse Chinese data requests.

Of course Huwei and Tik-Tok are not the only companies which could be used by the Chinese to gather data. Datenna has identified over 650 acquisitions by Chinese investors in Europe.You can view all these acquisitions on the China-EU FDI Radar interactive map. On this map you can explore European companies which have been acquired by Chinese investors and also view Datenna's rating of the level of Chinese state-influence in each acquisition.

The level of state-influence and the possible security threat of each acquisition is based on a number of different factors, these include the percentage of shares held, the shareholder structure and the level of state-control of any investors. Based on their ratings Datenna has identified over 160 acquisitions where there is a high level of Chinese government influence. These acquisitions are in a number of different sectors, including energy, transport and information communication technology. These acquisitions have also taken place across Europe and in every major European country.

Thursday, September 24, 2020

Mapping Chinese Detention Centers


The Xinjiang Data Project is an interactive map showing 380 suspected detention facilities in the Xinjiang region of China. In the last few years China has detained and arrested over a million Uighurs and other Turkic and Muslim minorities in the Xinjiang Uighur Autonomous Region (XUAR).

Many of the reasons for the arrest of people in XUAR have been farcical. Muslims have been arrested and imprisoned for having 'abnormal' beards, for wearing veils or for avoiding alcohol. In fact people have been arrested for any sign of religious belief or cultural affiliation.

The Xinjiang Data Project map shows the location of 380 detention facilities in Xinjiang where arrested Uighurs are being held. If you select a facility on the map an information window will open with more information, including details on what it is believed the detention center is used for. The Xinjiang Data Project Map also includes an interactive timeline which features significant events in China's persecution of people in the Xinjiang Uighur Autonomous Region.

More evidence of China's re-education detention camps can be viewed on an Amnesty International interactive map. Amnesty International has mapped reports given to them by relatives of imprisoned Muslims in China. The map tells the stories of many Uighur citizens. Most of these Uighurs live abroad but have relatives that have been arrested and detained by the Chinese. You can view and explore the interactive map in Amnesty's Up To One Million Detained in China's Mass Re-education Drive.

Thursday, June 11, 2020

Virtual Tours of the World's Museums


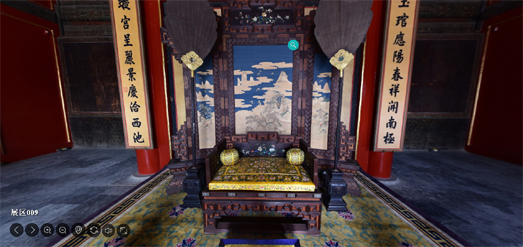
Beijing's Palace Museum is the world's most popular museum. It is visited by around 15 million people every year. The museum is located in the Forbidden City, which for nearly 500 years was the home of the Chinese Emperor and his household.

The Palace Museum has created a number of virtual tours which allow you to explore some of the museum's galleries and also some of the amazing buildings of the Forbidden City.

Among my favorites of the museum's current 15 virtual tours is a custom Street View tour of the Palace of Longevity and Health. The Palace of Longevity and Health was the home to the widowed consorts of emperors who had died. The widowed wives of late emperors lived in this separate area of the Inner Court of the Forbidden Palace. Being a wife of an Emperor may have come with a whole host of complications but you did get to live surrounded by beautiful opulence.

If you want to explore more of the Forbidden Palace then you might also enjoy the virtual tour of the Garden of Compassion and Tranquility. The Garden of Compassion and Tranquility is one of four gardens in the Forbidden Palace. The Palace of Compassion and Tranquility was another area devoted to empress dowagers (widows of an Emperor).

You can also explore virtual tours on the websites of many other art galleries and museums around the world.

The U.S. National Gallery of Art is temporarily closed but you can still explore some of the gallery's collections and exhibitions of paintings by visiting its virtual exhibitions. Currently the gallery has three virtual exhibitions: Degas at the Opéra Virtual Tour, True to Nature Virtual Tour (European landscapes of the 18th & 19th Centuries) and Raphael and His Circle Virtual Tour.

The Metropolitan Museum of Art - includes a number of virtual exhibitions
The National Gallery - London's National Gallery has a number of virtual tours
The Rijksmuseum Masterpieces Up Close - a virtual tour of the museum's Gallery of Honour
The Sistine Chapel Virtual Tour - explore the Sistine Chapel and Michelangelo's astonishing ceiling
The Smithsonian National Museum of Natural Museum - has created a number of virtual tours
The Stonehenge Virtual Tour - places you in the center of this mysterious pre-historic monument

Louis XIV's Palace of Versailles can be explored in this Google Arts and Culture tour.

Friday, March 06, 2020

The World in Quarantine


Tiananmen Square before & after the coronavirus outbreak

As the daily rate of reported new cases of Covid-19 continues to drop in China the World Health Organization has praised the country's containment efforts. WHO reports that,

"China has rolled out perhaps the most ambitious, agile and aggressive disease containment effort in history. ... Fundamental to these measures is extremely proactive surveillance to immediately detect cases, very rapid diagnosis and immediate case isolation, rigorous tracking and quarantine of close contacts, and an exceptionally high degree of population understanding and acceptance of these measures." - Report of the WHO-China Joint Mission on Coronavirus Disease 2019 (PDF)

Evidence of China's containment measures can be seen in maps of Chinese air traffic, in the fall of air pollution and in before & after aerial imagery of Chinese cities. In 13,000 Missing Flights the NYT visualized the scale of the reduction in air traffic by mapping air flights before and after the outbreak. The dramatic drop in air pollution caused by the huge drop in car traffic and shuttered factories has been visualized by NASA.Their Airborne Nitrogen Dioxide Plummets Over China shows how levels of NO2 have plummeted since the introduction of quarantines in China.

In Before and after: coronavirus empties world's busiest spaces The Guardian has published a number of before and after aerial images of locations around the world. These images allow you to compare the numbers of people visiting public spaces before the coronavirus outbreak with the numbers of people visiting afterwards. These before & after images include one comparing the busy roads around Tiananmen Square before Covid-19 to the empty streets seen after the epidemic. A similar scene is shown in Wuhan, the epicenter of the global outbreak, with normally busy streets now largely empty of road traffic.

Of course China isn't the only country where coronavirus has affected the numbers of people congregating and traveling. The Guardian article includes before & after images showing the impact of Covid-19 on the number of people visiting Mecca, where authorities have suspended the year-round umrah pilgrimage because of the Covid-19 epidemic.

Monday, March 02, 2020

All Quiet in the Quarantine Zone


China is rolling out a new mobile phone application, called Alipay Health Code, which is being used to enforce quarantine measures. The app indicates whether the owner of the phone should be quarantined or not and is being used to determine whether people can use public transit, or be allowed into malls and other public spaces. The app uses a color coded system to indicate an individual's health status. People who have been assigned yellow or red are having their movements severely restricted. The New York Times has also discovered that the application is sharing each user's information, including their location, with the Chinese police.

One effect of these stringent quarantine measures being imposed across China is a drop in transportation passenger numbers and a fall in economic activity. Two weeks ago the New York Times created an impressive side-by-side animated map visualizing the huge drop in air traffic over China since the outbreak of coronavirus. In response to the outbreak of the virus airlines have canceled more than 200,000 flights - both domestically, within the country, and internationally, to & from China. In 13,000 Missing Flights the NYT visualized the scale of this reduction in air traffic by animating a day's flights over China on January 22nd (before the outbreak) and a day's flights on February 13th (after the outbreak).

The imposition of quarantine measures and the restrictions on travel have not only affected air traffic. The reduction in road traffic and economic activity in China has also led to a huge drop in air pollution. Over the weekend NASA released a visualization comparing NO2 over China during January and at the end of February. Airborne Nitrogen Dioxide Plummets Over China shows how levels of NO2 have plummeted since the introduction of the coronavirus quarantine in China. According to NASA this fall in NO2 pollution was first apparent near Wuhan, but has now spread across the whole country.