Monday, December 31, 2018
The Most Popular Maps of 2018
I thought it might be interesting to have a quick look at which Maps Mania posts were the most popular in 2018. The number of page views is not necessarily the best guide to the popularity of individual Maps Mania posts or interactive maps (posts from January have had a lot longer to gather page views than posts from this week). However it can be a good guide to the sorts of posts that have been popular this year.
It's the Economy Stupid
In 2018 four of the top ten posts on Maps Mania were about the American economy:
Mapping America's Most Distressed Areas - this map of the Distressed Communities Index ranks the economic well-being of every community in the United States.
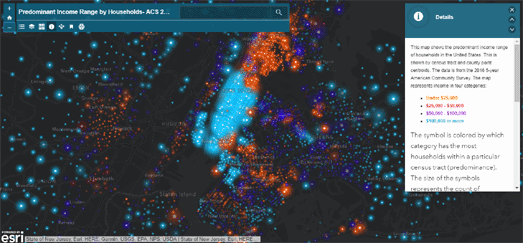
Income Inequality in Your Town - this Esri map shows how much money people are earning in each census tract in the United States. It shows the huge income inequality which can exist in different neighborhoods even in the same towns.
How Minimum is the Minimum Wage - this Esri map reveals the living wage level in each state and shows how the minimum wage has fallen or risen in real terms in each state over the last 48 years.
Saying Goodbye to the American Dream - this Esri map visualizes the areas of the USA with the highest percentage of non-citizen residents & DACA recipients and the estimated economic impact that their removal will have on an area's GDP.
Quadrennial Sporting Events
After the American economy the next favorite subject on Maps Mania this year was global sports events. Two maps about the Winter Olympics in Pyeongchang made the top ten. One map about the summer World Cup in Russia also made the top ten.
Pyeongchang 2018 - this Esri story map looks at how many gold medals different countries have won at past Winter Olympics, how each country's gold haul has changed over time and the global distribution of Winter Olympic gold medals.
The 2018 Winter Olympics Medal Map - an interactive map showing the numbers of medals won by each country at the 2018 Winter Olympics.
Russia's World Cup Stadiums - an interactive guided tour of the soccer stadiums which were used in the 2018 World Cup in Russia.
Miscellaneous
The other three maps to make the top ten most read posts were:
The Most Popular Street Names in the USA - these maps explore the most popular names given to roads in the United States of America.
Europe's Population in 3D - this 3D map shows the population of Europe as peaks and troughs, where height represents the population density at any point in the continent.
Mapping Lines of Sight - this Leaflet map can show lines of sight. It uses turf.js to map viewsheds - showing where an individual's line of sight would be blocked by buildings.
New Year's Eve Around the World
Esri UK has released a 'fun' interactive map which shows New Year's Eve celebrations taking place around the world. Press play on this animated map and you can watch fireworks gradually exploding across the globe as the new year spreads its way east across the world.
In truth there isn't much point to Esri's New Year's Eve Around the World. The map uses GMT. So, if you are British, you could use the map to find out where it is currently midnight in the world. If you aren't in the UK and you are desperate to know where it is currently midnight on Earth then you could work out your local time relative to GMT and then add or subtract the appropriate number of hours to the map.
As you can probably tell I'm not entirely convinced that this map has much purpose. If you are bored and aren't too bothered about wasting your last few hours of 2018 then by all means give it a whirl. The animated fireworks are quite nice.
Happy New Year!
Friday, December 28, 2018
The Global Prosperity Index 2018
Norway has been ranked the most prosperous country of 2018. Norway outperformed all the other 148 countries around the world based on the Legatum Institute's prosperity metrics. Afghanistan was ranked last of the 149 countries. The United States was ranked 17th for the ninth successive year.
Every year the Legatum Institute ranks the prosperity of countries around the world. The Legatum Prosperity Index uses a number of economic, governance and social metrics to measure prosperity as a combination of wealth and well-being. According to the Prosperity Index global prosperity has reached its highest level since 2007.
Although global prosperity continued to rise during 2018 the gap between the largest and smallest scores is the largest it has ever been. This means that the prosperity gap between the richest and poorest countries has continued to grow. You can find how each individual country has been ranked in 2018 on the Legatum Prosperity Index 2018 Globe.
The Prosperity Index Globe colors countries across the world based on their 2018 prosperity ranking. If you select an individual country on the interactive globe you can view its overall prosperity ranking and its individual rankings in each of the nine individual metrics which contribute to the overall score.
Monday, December 24, 2018
Santa Tracker
Santa has begun delivering presents to all the world's children. Google's Santa Tracker is also now busy at work.
Google uses GPS (the Gnome Positioning System) to track Santa's sleigh on Christmas Eve. They then plot his movements around the world on a real-time Google Map. While following Santa on Google Maps you can also keep track of the time remaining until Santa arrives at your chimney on the sleigh dashboard.
You can also follow Santa's progress this Christmas Eve on the Official NORAD Santa Tracker. Every Christmas NORAD's geo-synchronous satellites are able to detect the signature from Rudolph's red nose and observe when Santa Claus leaves the North Pole. They then proceed to track his movements for 24 hours as Santa delivers presents to children around the world.
While following along with Santa's global journey you can also listen to a selection of Christmas songs, played by the NORAD Commanders or the US Air Force Academy Band.
Saturday, December 22, 2018
The True Size of Countries
One of the most shared maps on social media over the last two months has been Neil Kaye's animated map which animates countries on a Mercator projection to 'their true size.' The animated map is a great illustration of the large distortions applied to countries the further they are from the equator on Mercator maps.
Engaging Data has now created an interactive version of the map using Leaflet.js. Real Country Sizes Shown on Mercator Projection allows you to switch between countries displayed using the Mercator projection and their 'true size'. The animated transitions again provide a great illustration of the distortions created by using a Mercator projection. Conversely it also provides an illustration of why the Mercator projection is so useful for navigating around the world.
As well as the animated map Engaging Data has examined the amount of distortion applied to different countries when using the Mercator projection. Greenland has the largest percentage difference between its size using the Mercator projection and it’s real size. While Russia is the country with the largest absolute difference between its 'real' size and its size on a Mercator projection.
Friday, December 21, 2018
Where New Jersey Police Use Force
On average police officers in New Jersey used force 4.2 times each from 2012 through 2016. However 5 percent of police officers in New Jersey are responsible for 25% of all occasions where force was used by the police and just 252 officers are responsible for 10% of all uses of force in the whole state.
Explore 17,354 Officers who Used Force in NJ is an impressive data visualization of New Jersey's police departments' use of force from 2012 through 2016. The visualization uses 17,354 dots, one dot for each of New Jersey's police officers. As you progress through the Force Report the visualization animates these dots into a series of graphs, charts and maps to help visualize how and why force was used by the state's law enforcement officers.
Each of the dots in the Force Report are colored to show the number of times each officer used force from 2012 through 2016. However the dots also organize themselves into a bar chart to show how many officers used force and how many times. As you progress through the visualization the dots rearrange themselves onto a map of New Jersey to show where the use of force is most used in the state.
If you want to know more about the use of force by your local police department in New Jersey you can search the Force Report data here. The Force Report allows you to search the database by the name of individual officers or by police department.
The Map of Yugoslavian War Victims
A new interactive map has been released to commemorate the lives of everyone who died during the Yugoslav wars. Around 130,000 individuals lost their lives during the conflicts. The map wants to map all the victims of the wars of the 1990s, regardless of their ethnic, political or social status.
The Hague international war crimes tribunal established that there were at least 18,000 victims of war crimes in the former Yugoslavia. However that figure does not include the soldiers and police officers who also died during the conflicts. The Map of the 1991–2001 War Victims in the Former SFRY was created by the Initiative for RECOM and Documenta using data from a number of different law and documentation centers. The map shows the locations of around 22,000 victims of the Yugoslav wars. Research is still ongoing into the other victims of the wars.
The map includes basic information on each person documented, including (where available) first name, surname, date and place of birth, parents' name, place of residence and ethnicity. The map may also record the time, place and manner of the individual's death and their status (civilian or military).
Thursday, December 20, 2018
America's Richest Neighborhoods
Bloomberg has been busy mapping where America's richest people live. Using data from the Census Bureau’s American Community Survey they have mapped out the neighborhoods which are attracting America's highest earners.
Americans Earning Over $200,000 Are Flocking to These Neighborhoods includes a map showing the concentration of households earning $200,000 or more in each county. Bloomberg has also mapped the 100 neighborhoods which have seem the highest growth in high earners since 2000.
The census tract which has seen the highest growth of households earning $200,000 is in Cook County, Illinois. Four of the top ten census tracts showing an increase in high earners are in commuting distance of Washington DC. According to Bloomberg in some of these areas "around half of households earn more than $200,000".
The Bloomberg article points out that the income divide in the USA is the largest it has been since 1960. This income gap is starkly illustrated in an Esri powered interactive map. The Income Extremes for Wealth Divide interactive map shows the richest and poorest households in each census tract area in the United States. The map visualizes two dot map layers showing the number of households earning over $200,000 and the number of households earning under $25,000. The result is a map which clearly shows the income divide in American towns and cities.
If you select a census tract on the map an information window opens displaying the tract's population and number of households. It also informs you about the number of households in the census tract which have an income greater than $200,000 and the number of households which have an income less than $25,000. The yellow and blue dots don't show the exact addresses of households but are randomized within each census tract area.
Santa's Digital Delivery Management System
Delivering presents to 325 million Americans during the course of just one night can create huge logistical problems. Luckily Santa is now able to use SDMS, the world's first comprehensive digital Santa Delivery Management System.
The Santa Delivery Management System maps out every home in America scheduled for a delivery on the night before Christmas. To ensure the most efficient delivery speeds the SDMS is designed to show the location of all homes with chimneys (Santa's preferred route of delivery). Even though the SDMS shows Santa the fastest delivery routes he still needs to maintain his energy. Therefore the SDMS can also show Santa the areas of the country where Americans are most likely to have cookies and milk in their groceries.
The Santa Delivery Management System ensures that Santa's sleigh can leverage real-time data to aid navigation around the globe. This information includes information on no fly zones, real-time weather reports and the real-time locations of other aircraft.
Mapping the Wolf at Your Door
Back in the year 2000 the first wolf in modern times arrived in Germany, crossing from Poland into the eastern state of Saxony. There are now reported to be over 1000 wolves in the country. The Berliner Morgenpost has created an interactive map which animates how wolves have begun to repopulate Germany.
If you press 'play' on the interactive map in Wölfe in Deutschland you can watch how wolves have spread, mostly across the north of the country, since the turn of the century. The map includes colored markers to indicate single wolves, pairs of wolves and wolf packs. The map also includes a search function which allows you to view how close the nearest wolves have been spotted to your home.
The wolf is not only on the rise in Germany. All countries in mainland Europe now have wild wolf populations. The Guardian has published a static map showing the wolf populations in different European countries. The Selected European Wild Wolf Populations map shows that the southern countries of Spain, Italy and Romania have the largest wolf populations in Europe.
Wednesday, December 19, 2018
Mapping Fire Risk in California
In 2018 nearly 20,000 homes in California were lost and more than 100 people were killed by wildfires. As global warming continues to create the perfect conditions for wildfires the risk to Californians is likely to grow. According to analysis by the LA Times one in ten buildings in California are in the Department of Forestry and Fire Protection's highest-risk fire zones.
In A million California buildings face wildfire risk the LA Times has created a series of hexagon density maps showing the concentration of buildings in severe fire hazard zones. This series starts with a map showing the areas in California with the largest concentration of endangered homes. It continues with individual maps showing the areas with the largest concentration of fire risk buildings in and around Los Angeles, San Diego and the San Francisco Bay Area.
The LA Times article also has an interactive map which shows the location of every one of California's 8,900 very severe hazard zones. The LA Times says that the total number of at risk homes in California is likely to be more than 114,000.
The Geography of Christmas Dinner
The UK's turkey population has grown 951% since 1945. There are now 3.5 million turkeys in the UK. Most of them will be eaten next week - on Christmas Day.
If you asked most people in the UK where their Christmas dinner turkey came from the vast majority would say 'Norfolk'. And they would have a good chance of being correct. The eastern county of Norfolk is synonymous with the rearing of turkeys. But the eastern county isn't the only place in the UK where turkeys are raised. A new interactive map shows that large numbers of turkeys are also reared in neighboring Linconshire and across the country in Herefordshire.
Emu Analytics, the data science and software company, has published a map showing where the UK's traditional Christmas Dinner ingredients come from and how their production has changed since 1945. The Christmas Dinner interactive map not only shows you where your turkey was reared, it also allows you to see where your roast potatoes were grown and where your pigs in blanket were raised.
The Christmas Dinner interactive map visualizes where your Christmas dinner ingredients come from and also allows you to compare their 2018 agricultural production to that of 1945. You can therefore use the map to see if the areas associated with different livestock and crops has changed since World War II. You can also how their production has dramatically increased. For example in 1945 there were 1.6 million pigs. There are now 3.9 million pigs in England. Conversely the number of hectares given over to growing potatoes in 1945 was almost 4 times higher than it is today.
One thing that the map clearly reveals is that farming is much more intensively concentrated in certain areas today. Back in 1945 the farming of potatoes, pigs and turkeys was fairly evenly distributed across the country. In 2018 there is a less even distribution with livestock and crops being grown much more intensively in specific areas of the country.
Tuesday, December 18, 2018
An Atlas of American Gun Violence
I remember the days when every other interactive map was a visualization of Starbucks outlets across America. Unfortunately these days every other interactive map seems to be a visualization of shootings in the USA.
An Atlas of American Gun Violence maps five years of American gun violence, during which time there has been over 150,000 shootings. On the map red markers show the locations of where at least one person was killed and yellow markers are used to show the locations of non-fatal shootings. The atlas includes an interesting animated tour which introduces you to the map and explains some of the patterns in American gun violence. You can use the filter controls to view shootings on the map by year, by fatal /non-fatal and by type of shooting.
The map uses data from the Gun Violence Archive, which has been collecting gun violence data for the last five years. Vox's Mass Shootings Since Sandy Hook Map also uses the Gun Violence Archive to map all the incidents of mass shootings in the USA. The Gun Violence Archive itself has a Charts and Maps section which includes a number of static maps of their gun violence data. This includes a map of all 13,998 people killed by guns in the United States so far this year.
The London Murder Map
There have been 130 homicides in London so far this year. The BBC has created an interactive map showing the location of each homicide, the date it occurred and the cause of death. London Killings: All the Victims of 2018 also includes a pen portrait of all 130 of the victims.
The BBC's interactive map uses Carto's temporal functionality to show where and when each London homicide occurred. Press 'play' and the visualization will animate through the whole of 2018 adding markers to the map by the date of each homicide. The colors of each marker indicate the cause of death. Underneath the map a histogram shows the number of murders in each week of the year. This histogram is interactive and can be used to filter the results shown on the map by date range.
The number of homicides in London has reached a ten year high this year. It would be wrong however to think that everything was always better in the past. If you want a little historical perspective then you might want to compare the BBC's map of 2018 homicides with the University of Cambridge's London Medieval Murder Map This map plots the locations of 142 murders which took place in the capital in the City of London during the first half of the 14th century.
Admittedly the 142 murders in medieval London took place over a longer time span than this year's 130 deaths. However the population of London in the 14th century was significantly lower than that of London today. What hasn't changed much is that stabbing was the most dominant form of murder in both medieval and modern London.
Monday, December 17, 2018
The Ancestry Map of America
The American Ancestry map shows the most populous ancestry, Hispanic or racial group in each census tract in the U.S. according to the U.S. Census Bureau American Community Survey, 2013-17. The map uses different colors to show you the ancestry, Hispanic or racial group (AHR) which most residents self-identify with in every census tract in the country.
In the screenshot above that pink color in the Midwest indicates German and the green color in New England shows a large proportion of the population have English ancestry. The orange color along the Mexican border shows, you guessed it, a large number of people with Mexican ancestry. If you zoom in on individual cities you can find more localized patterns of ancestry. For example in New York City you will find that Italian is the top AHR in lots of the city's suburbs. If you switch coasts and zoom in on Greater Los Angeles you will see that here many census tracts have Mexican as the most populous AHR.
If you hover over a census tract on the map you can view the actual percentage of the population who identify as the top ancestry, Hispanic or racial group in the selected tract and the percentages of the next five largest AHR groups.
You can also use the map's 'Layer' control to select individual AHR groups on the map. For example if you select 'A-Fi' and then 'Cuban' you can view all the census groups where people have Cuban ancestry. If you hover over any of the colored census tract areas you can view the percentage of the population with Cuban ancestry.
How to Make a Map Poster
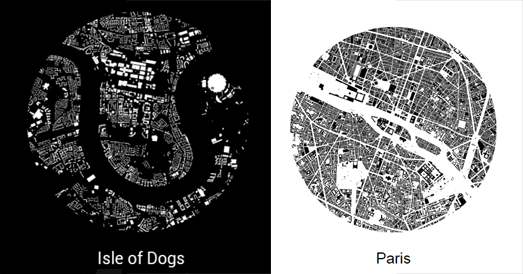
Here's a quick and easy way to make a simple map poster for any location in the world. Figureground Posters is an easy to use tool for creating map posters using OpenStreetMap data.
To create your poster simply click on the Figureground Posters interactive map to select the location that you want. You can then select a size for the area that you wish to map. Figureground Posters creates circular maps so just choose the radius size that you wish to map (up to 2000 meters). When you are happy with your chosen location and radius size just click 'Make Poster'. Figureground Posters will then create a simple map of your selected area using the building footprint data from OpenStreetMap.
Once you've created your map you can then add a place-name (or any other text to your map). You can also choose between showing your map as black building footprints on a white background or white building footprints on a black background.
That's it. You can now download your finished map poster as either a SVG or PNG image.
Saturday, December 15, 2018
Breaking Through the Bronze Ceiling
You may have heard of the Guerrilla Girls, who have been campaigning against the under representation of female artists in art galleries around the world. Back in 1989 the Guerrilla Girls surveyed all the works of art in New York's Museum of Modern Art. They discovered that less than 5% of the artworks in the Modern Art Department were by female artists. While 85% of the nudes featured in those artworks were female.
Women aren't only under represented inside art galleries. You probably won't be too surprised to hear that they are also under represented in those works of art that are displayed in public spaces. For example in Budapest there are more statues of animals than there are statues of women.
Atlatszo has analyzed all the statues that are owned and maintained by the municipality of Budapest. Of the 1,173 statues in the streets of Budapest 785 depict men. Only 150 statues depict women. A large proportion of the statues depicting men are of historical figures. Only 35 of the 1,173 statues in Budapest are of named historic women. The majority of the other statues of women are unnamed nudes. You can find out where all 150 statues depicting women are on the streets of Budapest on an interactive map in Atlatszo's Data Visualization of the Hungarian Bronze Ceiling.
Women aren't only under represented in artistic memorials. They are also under represented in the very names we give to the streets in which we live. For example an analysis of the Street Names in Vienna reveals that 4,269 streets have been named for men. Only 356 have been named for women.
Geochicas have also been investigating the under representation of women in street names. Their Las Calles de las Mujeres is an interactive map which shows all streets named for men and women in a number of Spanish and Central & South American cities. A pie chart on each city's map shows the percentage of streets named for both men and women in that city.
Mapbox has also created an interactive map showing the distribution of male and female street names in major cities across the world. According to Mapping Female versus Male Street Names if you add up all the streets in Bengaluru, Chennai, London, Mumbai, New Delhi, Paris, and San Francisco only 27.5% are named after women.
Friday, December 14, 2018
Eating the World
If everyone in the world had the same diet as an average American then the Earth would soon run out of food. What we eat is extremely important in determining the amount of land required to produce our food. Livestock takes up nearly 80% of global agricultural land, yet produces less than 20% of the world's supply of calories. If every country in the world adopted the US's meat based diet then we would need 138% of the world's current habitable land area. In other words we would be incapable of feeding ourselves.
Our World in Data has created an interactive map which shows the share of global habitable land needed for agriculture if everyone had the diet of each country. The countries colored red on the map all have diets which would be completely unsustainable if the whole world adopted the same diet.
Currently around 50% of the world's habitable land is used for agriculture (77% livestock & 23% crops). The countries colored green on the map are those with diets which if adopted worldwide would allow the world to continue using 50% (or less) of habitable land for agriculture. The countries colored yellow have diets which if copied across the globe would mean we had to increase the percentage of habitable land devoted to agriculture. This could be feasible as none of these country's diets would require more than 100% of habitable land being used for producing the world's food requirement.
Where Sharks Attack
The International Shark Attack File (ISAF) has been tracking shark attacks around the world since 1958. The ISAF is housed at the Florida Museum of Natural History and is the only scientifically-generated database that documents and monitors shark attacks on a global basis.
The ISAF has released a new Unprovoked Shark Attack Interactive Map, which allows you to browse the ISAF's historical records by location, date and by shark species. The map shows where sharks have attacked humans around the globe. It is possible to filter the shark attacks shown on the map by fatal and non-fatal attacks. In the map filters (below the map) you can click on the external link icons to learn more about the different species of shark.
The ISAF Maps & Data section of the Florida Museum of Natural History includes more interactive maps about shark attacks around the world. In this section you can view regional maps which provide more localized heat maps showing where shark attacks have occurred off the coast of different countries and regions of the world.
Exploring the Life of Maimonides
Moses ben Maimon, commonly known as Maimonides, was a medieval Jewish philosopher. He is revered as one of the most influential Torah scholars of the Middle Ages. The Israel Museum and the National Library of Israel is holding a joint exhibition on the life and works of Maimonides. It has also created an interactive map which allows you to discover more about some of the unique items being displayed in the exhibition.
In There was None Like Moses you can select individual artifacts on the map to learn more about their history and their role in the Maimonides exhibition. The map shrinks the globe down to a size that reflects the world known to Maimonides in the 12th century. The map is therefore not entirely geographically accurate.
The four cartouches in the map corners allow you to learn more about Maimonides and his work. The cartouche in the bottom left corner of the map provides a link to the Ktiv - The International Collection of Digitized Hebrew Manuscripts website of the Israel National Library, where you can view the digitized transcripts of Maimonides' works and manuscripts.
Thursday, December 13, 2018
The Racial Dot Map of Australia
voomMaps has created a series of dot maps which show the distribution of racial groups in Australia's largest cities. Race Dot Maps uses 2016 census data to plot the racial classification of each person living in each census area in 14 different Australian cities.
The colors of the dots on each map indicate the racial group of each individual. If you click on the 'Legend' button on a map you can learn which racial group each color represents. The Australian census recognizes 300 different categories for ancestry. For the purposes of the Race Dot Maps these 300 categories have been aggregated into seven racial groups. To protect anonymity the dots for the different racial groups are distributed randomly within each census tract area.
After the 2011 ABS census the City Science group at Monash University created an Indigenous Dot Map of Australia. showing the distribution of Australia's indigenous population. Every dot on this map shows an indigenous person counted in the 2011 Australian census. The map shows the spatial distribution of the 699,990 indigenous Australians counted.
Indigenous Australians make up 3% of the total Australian population. Looking at the map indigenous Australians seem to make up a larger proportion of the population in the north of the country. Apparently the Northern Territory has the largest proportion (30%) of its population who are indigenous, which appears to be borne out by the map.
The City Science group has also created a Chinese Population Dot Map of Australia. This map shows the distribution of the 866,001 Australians who self identified as Chinese in the 2011 census.
Also See
The Racial Dot Map of the USA
The Racial Dot of Brazil
The Racial Dot Map of South Africa
The Racial Dot Map of Estonia
US Average Life Expectancy
Where you live can have a huge influence on how long you can expect to live. People who live in New York's Chinatown have a life expectancy of 93.6 years. However people who live in nearby Roosevelt Island have a life expectancy of just 59 years. You can discover the average life expectancy in your neighborhood on this new interactive map from Quartz.
Quartz's Life Expectancy Map reveals the average life expectancy in nearly every US neighborhood. The map uses data from the Center for Disease Control's U.S. Small-area Life Expectancy Estimates Project, which tracks life expectancy at the census tract level. If you hover over your neighborhood on Quartz's map you will discover the average life expectancy in your census tract and how that compares to the state and national average.
The average life expectancy in the USA is falling. Between 2016 and 2017, the average life expectancy in the US fell from 78.7 to 78.6 years. The CDC blames this fall on the large increase in drug overdoses and suicides. The UK is also now experiencing a similar fall in life expectancy, while not suffering from the same scale of deaths from opiate abuse as the USA. In both the US and the UK there is obviously growing health inequality, where those who who live in more economically deprived areas can not expect to live as long as their neighbors in wealthier neighborhoods.
Wednesday, December 12, 2018
The Place-Names of America
John Nelson recently noticed that navigable passages between mountains in the USA have lots of different names. Some are called passes, others are called gaps and some are even called notches, or saddles. Being a cartographer John wondered whether there could be any regional variation in the use of these names for navigable valleys. He therefore mapped out where these place-names are used in the USA and released the results in the Gap, Pass, Notch and Saddle story map.
To examine the regional variations in the words given to navigable valleys in the USA Nelson downloaded and mapped every named place from the U.S. Board of Geographic Names. The result is a fascinating map of 2.3 million place-names in America. As you scroll through the Gap, Pass, Notch and Saddle story map you are shown how place-names in the USA concentrate where humans settle along coastlines, along transportation routes and in major conurbations.
As you progress further though the Gap, Pass, Notch and Saddle story map the non-valley place-names are removed from the map. The different navigable passage place-names are then each given a different color. The result is a map which reveals the regional variations in how these passages are named throughout the USA.
If you are interested in carrying out your own toponym research John has included a link to download the huge place-name database from the U.S. Board of Geographic Names. Alternatively you could be lazy and play with Places! instead.
Places! allows you to map the relative density of place-names in different countries around the world. Using the application you can enter place-name prefixes or suffixes and view a map showing the geographic distribution of place-names containing those terms.
For example, in the USA we can enter the prefix of -Las to see where towns and cities have names starting with the Spanish word for 'the'. In the UK we can view where place-names include the suffixes -thorpe and -thwaite to see where the Vikings settled in Britain (the resulting map shows that these two place-name endings are popular throughout the area that was once known as the Danelaw, following the Viking invasions of the ninth century).
The Places! application uses OpenStreetMap for the place-name data. The application includes a number of options which allow you to adjust the size of map, circle points and an 'advanced' option which allows you to carry out 'regular expression' searches.
You can have hours of fun with Places! For example in the USA if you are interested in where Spanish plays a large part in local place-names you could also search for the distribution of the San- or Santa- prefixes. On the other hand the suffix -ville might be a good indication of where French immigrants originally settled in the USA.
Where's the Plaque?
Read the Plaque has mapped the location of over 17,000 plaques around the world. Using the Read the Plaque interactive map you can search for plaques marking historical or interesting locations around you.
As well as searching for plaques by location you can search Read the Plaque by tag or by the most recently submitted plaques. You can also select to view a random plaque from the over 17,000 recorded plaques. When you select a plaque on the map you can view its dedicated page, which includes a photo of the plaque and a transcription of the text on the plaque. A map also shows the plaque's exact location and the location of nearby plaques.
Anyone can submit a plaque to Read the Plaque by taking a photo of the plaque and marking its location on an interactive map.
Tuesday, December 11, 2018
The Euler Spiral Map Projection
A Euler spiral is a curve whose curvature changes linearly with its curve length. A Euler spiral can therefore be used to create a map projection by projecting a curved globe onto a flat spiral. The interesting point for cartographers is that the more spirals used in a Euler spiral map projection the less distortion there is.
Now for the math. By cutting a sphere along a spiral with width 1 / N and flattening out the resulting shape we create a Euler spiral when N tends to the infinity. In other words we can create a map projection whose distortion tends to zero as N tends to the infinity.
If this sounds a little confusing then it might help to play with an interactive Euler spiral map. This interactive Euler Spiral Map allows you to adjust the number of spirals used in the projection by changing the thickness of the spirals. By reducing the thickness of the spirals you can increase the number of spirals used in the map projection. The more spirals you create then the less distortion in the projection.
Unfortunately for cartographers a Euler spiral map projection is not very useful for navigating with. If you are still confused then this excellent Numberphile video explains the projection far more clearer than I can:
Where You Should Worry About Earthquakes
The OpenQuake Map Viewer provides free and open-source visualizations of global earthquake hazards. Each of the Map Viewer visualizations uses the OpenQuake engine, a seismic hazard and risk calculation software, to show seismic risks & hazards and seismic exposure around the world,
Currently the OpenQuake Map Viewer provides three separate interactive Leaflet powered maps: the Global Seismic Hazard Map, the Seismic Risk Map and the Global Exposure Map. The Global Seismic Hazard Map shows the potential for seismic activity based on hazard and risk calculation models. The Seismic Risk Map visualizes the average annual cost of seismic activity around the world. The Global Exposure Map is a visualization of the built upon areas of the world.
The Global Seismic Risk Map can provide individual country seismic risk assessments. Click on a country on the Risk Map and you can view details on the annual cost of seismic activity for residential buildings, commercial buildings and industrial buildings. You can also download the full OpenQuake profile for the selected country.
Making Play Maps for Children
Kinderkiez turns digital maps into real life play mats for children. If you are looking for a map present for a child (or for the grown-up kids in your life) then you can't do much better than these wonderful nursery mats which depict a map of any location in the world.
Using the Kinderkiez creation tool you can select any location in the world for your play mat. Once you have chosen a location Kinderkiez combines real geodata with the amazing illustrations of children’s book author Laura Bednarski to create a unique map designed for young children. You can also customize the look of your map by selecting your own favorite Bednarski illustrations and adding them to any location on the map.
When you are happy with your map you can go ahead and order your personalized nursery map. The finished product has a durable surface and a slip-proof latex back. The mat is also washable at 30°C.
The Kinderkiez nursery play map not only provides a colorful and safe surface on which children can play, it is also great for learning. It can be used to teach kids the way to school and impart important facts about road safety. Alternatively it can just be used as a great surface to play with your favorite toy cars.
Monday, December 10, 2018
Where is the News?
Forbes has carried out an analysis of the Television News Archive to create a series of maps showing which areas of the world have featured in the news programs of some of the major television networks. The Forbes article Mapping a Decade of Television News includes maps showing the coverage around the world of the BBC, CNN, Fox News and MSNBC.
Unfortunately the article only has static maps which does make them a little difficult to read and compare. However these maps are PNG images which means you can click on them and view them in full-screen mode. Personally I can't make out a huge difference in the global coverage of the different television news channels. The obvious major difference is that the BBC has much more UK news than the American stations and the American news channels cover American news more than the BBC.
Overall there seems to be a lot of agreement about where the major news stories are around the world. At the end of the article there are two videos of animated maps showing where the featured news channels have focused their attention around the world over time. These animated maps show the focus of the news channels traveling around the world responding to global events and then moving elsewhere as the world's attention moves on.
The World's Population Pyramids
Earlier this year The Pudding created an impressive interactive map which visualized the world's population in 3D. The Pudding's Human Terrain interactive map shows population density across the globe using 3D population pyramids. The taller a pyramid block on The Pudding map then the more people live there.
The Pudding has now used its own map to explore in more detail the pattern of population density around the world. In Population Mountains The Pudding examines how unevenly the world is populated and how population density can take different forms in different parts of the world.
For example The Pudding compares the pyramid population maps of some European cities to Kinshasa, DRC. In Kinshasa poor transportation infrastructure has led to a densely populated city center, whereas European cities tend to have less densely populated centers and more densely populated suburbs. Because of poor transportation in Kinshasa the population pyramids in the city center fall sharply away, while in European cities there tends to be a more gradual slope from the center away into the suburbs.
If you don't like The Pudding's 3D visualization of the world's population then you might prefer the SEDAC Population Estimator (GPWv4). This interactive map uses NASA's Earth Observing System Data and Information System (EOSDIS) data to show where the world's population lives. The SEDAC Population Estimator map includes a tool to draw an area on the map to view an estimate of the population that live there.
How Religious is Europe?
Romania has the most religious population in Europe. 55% of Romanians are 'highly religious' according to a recent Pew Research Center survey. The least religious population in Europe lives in Estonia, where only 7% are highly religious.
In How Religious is Your Country? Pew Research discovered that in general Central and Eastern Europeans are more religious than Western Europeans. In Central Europe the southern mainly Roman Catholic countries of Italy, Spain and Portugal are more religious than most other Central European countries. Although Ireland, another mainly Roman Catholic country, also scores highly when compared to other Central European countries.
The Pew assessment of its religious survey of European countries is accompanied by a choropleth map which shows the level of religious belief in 34 European countries. You can mouse-over individual countries on the map to see what percentage of the country's population are highly religious. In its survey Pew looked at four measures of religious observance. These were: attending religious services at least monthly, praying at least daily, believing in God with absolute certainty and saying that religion is very important to them. Those people who scored highly on at least two of these measures have been deemed to be 'highly religious'.
Sunday, December 09, 2018
The Queensland Bushfires from Space
The United States is not the only country in the world to have suffered from record levels of wildfires this year. Last month hundreds of bushfires ravaged the Australian state of Queensland. The intensity and scale of the fires were worse than any fires previously experienced in the state.
ABC News has used satellite imagery to help show the massive areas of the state that have been affected by the fires. In From space, the ferocity of Queenland's bushfires is revealed satellite imagery from the European Space Agency’s Sentinel 2 satellite has been used to reveal the areas affected by the fires.
As you scroll through ABC's presentation the satellite imagery shows around 45,000 hectares of land which were scorched by the fires. The imagery also reveals the homes which were threatened by the fires. Most worryingly the satellite imagery shows how the bushfires penetrated the region's rainforests, an extraordinary development which has alarmed fire scientists. Rainforests usually do not burn so this development shows how extreme global warming is creating environmental conditions outside of our previous experience.
Friday, December 07, 2018
The Most Sung About Locations
New York is the most sung about city in the world. Closely followed by London, LA, Paris and Miami. Celebrity Cruises has released an interactive map which reveals the most sung about locations across the globe.
To make Music Mapped Celebrity Cruises scanned the lyrics of over 200,000 songs. These songs all appeared in the top 40 of the US Billboard Hot 100 and UK Official Singles chart since 1960. Celebrity Cruises noted every mention of a city, town, neighborhood or state which appeared in these songs. This extensive research resulted in a final data set of 2,000 songs by 896 artists with 420 different places mentioned around the world.
The size of the markers on Music Mapped reflects the number of songs which have been sung about that location. If you click on a location's marker you can discover all the songs since 1960 which have mentioned the selected place. You can even click through to listen to each of those songs on Spotify.
Thursday, December 06, 2018
Dangerous Biking in LA
An interactive map by the LAist reveals that there is almost no section of road in Los Angeles where a cyclist hasn't been injured. The L.A.-Long Beach Bike Crashes interactive map shows the location of every collision within Los Angeles and Long Beach involving bicycles from 2010-2015.
The LAist argues that with its wide, flat roads and sunny weather LA should be a wonderful place to cycle. However Bicycling Magazine has named Los Angeles America's worst city for bikes. Looking at the LAist interactive map it isn't hard to see why. The map shows that from 2010-2015 70 bicyclists were killed and 13,606 were injured while cycling on the city's roads.
The LAist point out that the city's Three Feet for Safety Act is very rarely enforced. This law requires drivers to leave at least a three foot gap when passing a cyclist. However the police have issued only 13 citations in the four years since the act became law. The LAist's conclusion is that the city needs to invest in cycling infrastructure. The best way to ensure the safety of cyclists is to create separated bike lanes so that car drivers actually are incapable of driving within three feet of a cyclist.
Global Wind & Rain
The animated interactive weather map Ventusky now has a new radar layer, which can show the levels of rainfall around the world. The Ventusky weather map offers highly accurate data about weather conditions around the world. It now offers even more accurate precipitation data across the globe.
Ventusky has been working on its new radar layer for over a year. The layer uses sources from all around the world. It includes data from nearly 200 weather radars in North America, covering the USA and Canada. It also includes data from 100 weather radars from Europe and a few dozen more radars around the globe.
On the map the radar layer shows the intensity of precipitation. This intensity of precipitation is displayed using colors ranging from blue for light precipitation to red for very heavy precipitation. Using the timeline controls, running along the bottom of the map, you can animate the radar layer to observe precipitation moving and developing over time.
The Most Densely Populated Areas in Europe
The most densely populated square kilometer in Europe is in the center of Barcelona. This square kilometer in the Sants-Montjuïc district of Barcelona is home to 53,119 people.
Dan Cookson's Hyper Density in EU maps every square kilometer in Europe with a population of over 10,000 people. Kilometer squares with a population over 10,000 are colored on the map to show their population density. Each of the colored square also has a label which shows the exact population living there according to the European Commission.
If you want to know which areas are the most densely populated in each European country then you can refer to Alasdair Rae's article on The Most Densely Populated Square Kilometre in 39 European Countries. In this post Alasdair shows a satellite view of the the most densely populated kilometer square in each European country. Each satellite image also includes a small inset map showing you where that most densely populated area is
If you are interested in areas which aren't so densely populated then you should also check out Dan's previous European population map. The EU Population 2011 by 1km Grid visualizes the number of people living in each square kilometer of the whole EU.
Wednesday, December 05, 2018
The Autocomplete Map of the USA
A few years ago autocomplete maps were very popular. Then they went away for a while. Now they are back!
Autocomplete maps show you the most searched for phrases on Google for different locations. For example if you type into Google 'why is Alaska ..' Google will list a number of auto-complete suggestions based on how most people use that question stem when searching on Google.
On Google most people use the 'why is Alaska ...' form of question to ask 'why is Alaska so cold'. Conversely the question stem 'why is Arizona ..' is most often used on Google to ask 'why is Arizona so hot'. You can find out the autocomplete suggestions for other states on The United State of Wonder interactive map.
The map shows the autocomplete suggestions for each US state for the question stems:
'Why is ... ?'
'When will ...?'
'Can ...?'
You can make your own global autocomplete maps using Map Channels' Autocomplete Maps. This tool, released in 2014, lets you enter your own question stems to create an interactive map showing the autocomplete suggestions for that question for locations around the world.
Russia's Attack on the World's Democracies
Russia seems intent on destabilizing democracies around the world. In just the last three years Russia has hacked into the servers of the Democratic Party in the USA, assassinated a person in the UK and, most recently, fired upon Ukrainian ships.
The Alliance for Securing Democracy has been tracking where and how Russia has been interfering in more than 40 countries around the world. You can explore these discoveries on the Authoritarian Interference Tracker. Click on an individual country on the Authoritarian Interference Tracker interactive map and you can view all the recorded incidents where Russia has interfered in that country's democratic process.
The Alliance for Securing Democracy categorizes Russia's interference in democracies into a number of different areas, including cyberattacks and political & social subversion. The map uses pie charts as markers to show the scale of these different categories of attacks by Russia on individual countries. The size of the pie charts are proportional to the scale of Russia's attacks on that country. If you select a country on the map you can read more about each individual incident, as listed below the map.
Building on Britain
Just under 6% of the UK is built on. More than half the land is farmland and around a third of all land is natural (heath, moorland etc). You can discover how much of your local area is built on using the BBC's new interactive map.
How Much of Your Area is Built On uses new data on UK land use, which was derived from analyzing satellite imagery. Enter your location into the BBC's interactive and you can find out how much of your local area is natural, farmland, green urban or built on. A map of your area shows which parts fall into each of these four categories of land use. You are also shown the total percentage of land in your area which is given over to each of the four categories and how that compares to the national average.
While 6% of the UK is built upon only 3.6% of America is dedicated to urban areas. You can find out about American land use in Bloomberg's Here's How America Uses its Land.
If you live outside of the UK or the USA then you can use the OSM Landuse Landcover map to get an idea of the different percentages of land use on your area. This map uses OpenStreetMap data to map land-use and show the percentage of different types of land-use around the globe.
The OSM Landuse Landcover map uses contrasting colors to show how areas have been tagged in OpenStreetMap for land-use and land-cover. If you zoom in on a location on the map you can see how different areas have been tagged for land use and land cover. A dynamic pie chart also provides an overview of the percentages of different types of land use in the current map view.
Obviously the data on the map is only as accurate and complete as the data in OpenStreetMap.
Tuesday, December 04, 2018
Discover Your 2018 Climate Twin
In the year 2080 London will experience weather which resembles the climate in Lima today. Frankfurt in Germany will be as hot as Malawi and living in Berlin will be like living in Lesotho in southern Africa.
You can find your 2080 climate twin using The Summer of 2080 Will Be This Warm interactive map. If you enter your location or click on your location on the map you can view the town or city in the world which has a climate now which is similar to the climate you can expect in your location in the year 2080. The map uses two different climate models. This allows you to find your climate twin for a global warming scenario of 4.2 degrees or 1.8 degrees.
When you search for your climate twin the map displays some details of the kind of weather experienced by your twin now (and which you can expect to experience in the year 2080). This includes the annual rainfall and the number of extreme hot and cold days.
The Flood Risk Map of England
The UK government's Long Term Flood Risk Map for England provides an overview of the chances that any location in the country will flood in any year. It shows you the chances that locations will flood in any given year from either surface water, groundwater or from rivers or the sea.
Locations are colored on the Flood Risk Map to indicate the chances that they will flood in a year. You can also click on a location on the map to view the local chances of flooding. An area that is shown as having a high risk of flooding has more than a 3.3% chance of flooding in any given year. A medium risk indicates a 1-3.3% chance of flooding and a low risk has 0.1-1% chance of flooding in any year.
The UK government can also provide a flood risk assessment for any individual property in the UK. If you enter an address into the Long Term Flood Risk Assessment you can find out the property's risk level from rivers or the sea, from surface water or the risk from groundwater flooding.
Monday, December 03, 2018
Comparing Countries by Size
Jason Davies has arranged the world's countries in order of land area. Russia, the largest country in the world, is the first country to appear on Jason's Countries by Area visualization. Luxembourg, the smallest country in the list, comes last.
The map of every country in this visualization is reproduced to scale. This means that the countries at the bottom of the visualization are very small when compared to Russia. This is presumably why Countries by Area stops at Luxembourg. Each of the countries are colored by continent. You can mouse-over the individual countries to view its size in square kilometers and its ranking in the list of countries by size.
You can make a direct comparison of the size of any two countries using the True size of interactive map. This map allows you to overlay any country in the world on top of the outline of any other country.
The True size of interactive map doesn't limit you to just two countries. Why not see how many of the smaller countries in Jason Davies list you can fit inside the outline of Russia?
Transmarine Dream
Come and explore the strange transmarine dream of Andy Woodruff's Beyond the Sea.
Back in 2016 in Beyond the Sea Andy Woodruff answered the question of what lies beyond the sea for locations around the world. He created a series of maps which showed where each continent could be seen from (if you ignore the curvature of the Earth and our imperfect eyesight) from every other continent. His maps show what lies directly across the ocean if you take into account the direction of the coastline at any given point.
Andy has now created an animated interactive map which visualizes all the locations which lie directly across the sea on one integrated map. Click on a country on the Interactive Beyond the Sea map and you can see colorful lines shoot out to show the worldwide locations that can be 'seen' if you look directly out from any point on the selected country's coastline.
The colors of the lines represent the different destination continents. The result is that if you click on a country you can watch a colorful 'firework display' of animated lines shooting out around the world. If you select the 'start fireworks' option you can actually watch the world's coastlines exploding in one global transmarine dream.
Flooding Models for the Netherlands
The University of Gronigen has released an interactive map which shows which areas of Friesland are vulnerable to storm water flooding. The Wolk Viewer map models how rain water flows through the streets after a heavy rain storm. It simulates both the flow paths of the rainwater and where standing water would accumulate. The map covers most of the Friesland area of the Netherlands.
The Wolk Viewer simulated flooding model is based on 60mm of precipitation an hour. The model is intended only for the analysis of flooding in built-up areas, which means the model only provides a reliable picture in urban areas. The map has two buttons which allow you to view the flow paths and standing water separately on the map or to view both layers together.
The flooding model shown on the map is based on a WOLK model originally developed by the Tauw engineering firm. A WOLK (CLOUDS) model is a simple flooding model which uses a digital elevation model to show how water moves from higher levels to lower levels, while filling up lower levels with water. It provides a reasonable guide to which areas are vulnerable to flooding during a heavy rain storm.