Here is Crowdsourced Texas
Yesterday I asked people to draw Texas on an interactive map of the United States (if you haven't drawn Texas yet then you can still do so on this Where is Texas? survey map).
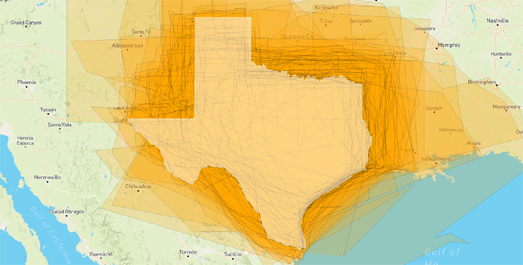
So far over 300 people have taken the time to complete my geographical survey by drawing the outline of Texas - or at least where they think it is. You can view all the polygons drawn so far on this Here's Texas? map. The map shows all the entries submitted so far to my Where is Texas map survey. The real Texas is shown as a white polygon on the map.
I'm very impressed with the entries so far. Most people seem to have a pretty good idea of the shape of Texas and where it is. I really doubt that the guesses would be so accurate for one of the smaller states, such as Connecticut or Delaware (I certainly wouldn't get their shapes or locations correct).
If you want to create your own geographical survey then you can remix my Where is Texas? map on Glitch. To do so just click on the fish icon and select the 'Remix on Glitch' button. I've had a number of suggestions about how to improve the survey on Twitter. These include revealing the border of Texas after a user has submitted a guess or by revealing how much bigger or smaller the area drawn was than the area of Texas. I haven't added either of these to my map because that would make the tool harder to remix and clone. If you want to use the 'Where is Texas' map for your own survey all you need to change is the text. Currently if you remix / clone this survey you just need to change the instructions to refer to the geographical area of your choice.
If you do remix the project then I'd love to see it. Just leave a link to the project in the comments to share your map survey. If you do clone the survey and want to make it better here are three suggestions for developing the map:
1. Add a GeoJSON shape after a user submits their drawn polygon. It would be relatively easy to add another function to the submit button so that the area surveyed is revealed on the map after a user's submission. This would allow users to compare their drawn area with the real area.
2. Tell the users how big in square miles / kilometres their drawn area is and how this compares to the real area they were meant to draw. You could do this using Turf.js. This example from the Mapbox documentation shows you how to use Turf.js to calculate the area of a drawn polygon.
3. Show all the drawn polygons by other users after a user submits their drawn polygon (so you would show a map similar to my 'Here is Texas' map showing all the submissions). I haven't managed to work out how to do this yet - so I would love to see your map if you do this!


Comments
FWIW I mostly used town names and the interstate to draw. I knew it was way off but don't have enough visual memory to have worked out how to change it. Fortunately my life didn't depend on it.
#4 some measure of accuracy. I'm not knowledgable in this area, but say 100 points on actual boundary and calculate distance to nearest point of user drawn line; take the average of those distances.
PS The reCAPTCHA is worse than it used to be and it was annoying then.