Showing posts with label Leaflet. Show all posts

Thursday, November 01, 2018

Environment & Weather Layers for Leaflet


If you need some environment or weather related map layers for your Leaflet.js maps then you should have a look at Leaflet Environment Layers. This Leaflet library allows you to add a combination of different environment and weather layers to your interactive maps.

The Leaflet Environment Layers plug-in includes map layers from a number of different sources. The weather layers (including rain, precipitation, wind and temperature) are from OpenWeatherMap. The environmental layers are provided by organizations such as SkyTruth (environmental alerts), the Environmental Protection Agency (toxic releases) and other agencies,

You can view a demo of a map with the Leaflet Environment Layers added here. The Leaflet Environmental Layers library itself is available on GitHub.

Wednesday, December 02, 2015

15 Cool UX Effects for Leaflet Maps


Map Effects 100 is a collection of user interaction effects for Leaflet maps. The effects range from polygon fades to custom designed pop-ups. There is even a nice story map template for scroll-driven map navigation.

All fifteen effects can be viewed on its own demo map and the code for each effect can be viewed on GitHub. If you go the Map Effects 100 GitHub page itself you can also contribute to the project by submitting your own Leaflet interaction effects.

The Map Effects 100 GitHub page also includes links where you can download any third party JavaScript libraries that might be needed for any of the individual Leaflet user effects.

Friday, October 23, 2015

Viral Maps


The Leaflet TimeDimension plug-in allows you to animate layers on a Leaflet map in a number of different ways in order to show changes in data over time. The examples page includes a number of different maps showing how the plug-in can be used in lots of different ways.

A new Oil Spill Simulation provides a neat demonstration of how the plug-in can be used to animate a polygon on a Leaflet map. When you press play on the map the polygon flows and grows on the map, kind of reminiscent of a virus moving around, as seen through a microscope.

In this demo map the plug-in is being used to simulate the trajectory of a hypothetical oil spill over time. There is something wonderfully organic about the resulting animation. The animated polygon feature of the plug-in might have limited use cases, but I can see it being useful, particularly for mapping pollution over time. Not just in the case of oil spills, but also to show the spread of noise or air pollution over the course of 24 hours or a week or any other time period.

Thursday, October 22, 2015

Animated Polylines in Leaflet


I've been waiting for this Leaflet plug-in for a while. Leaflet.Polyline.SnakeAnim animates a polyline on a Leaflet map so that you can show an animated route on your map.

The GitHub page for the plug-in includes an animate GIF of Leaflet.Polyline.SnakeAnim in action but doesn't include a working example. I've therefore created a quick demo map. In my demo I've changed one main thing from the demo.html on the GitHub page. I've moved

map.addLayer(path);

inside the animation function so that the route polyline doesn't appear on the map before it starts animating. To animate the route on the map just press the button.

Wednesday, October 21, 2015

Color Filters for Maps


Leaflet Tilefilter is a nice plug-in which allows you to change the appearance of a Leaflet map in the browser. It enables you to change the contrast, brightness and hue of a map's underlying map tile set.

The plug-in works by using Canvas and CSS3 filters. Using the filter controls map users can adjust the look of the map tiles. They can even combine the Canvas and CSS3 filters, which allows for quite a wide choice of variations.

On first seeing Leaflet Tilefilter in action I immediately thought it might be interesting to create a map which animated through random color filters. In other words to create something a little like Random Google Maps. However that seems a little pointless and in fact the example map Filters Demo is a much nicer example of what you can achieve with Leaflet Tile-Filter.

In effect the plug-in provides you with the option to add controls to a Leaflet map which allows the user to adjust the visual appearance of the map. This could be a handy option to provide, especially for users who suffer from some forms of color-blindness.

Monday, September 07, 2015

Synchronized Map and Globe


Map & Globe synchronizes a Leaflet map with a D3 globe. Pan around on either map and the other map will move to show the same map center.

That's all it does - but I like it. If you wanted you could use the code from Map & Globe to create a small inset globe on a Leaflet map, to show the global position of the current Leaflet map center. Or you could use them the other way round - to provide a small inset Leaflet map in the corner of a D3 globe.

A neat design feature is that both maps use the same simple black & white map colors. If you wanted to use a different map tile set in the Leaflet map it should be a simple task to change the colors in the D3 globe to match the two dominant colors in your Leaflet map.

Tuesday, June 30, 2015

CSS Filters for Maps


This Japanese map is a nice example of both a dual map display and the use of CSS filters to change the hue and brightness of a map.

CSS Filter provides a side-by-side comparison of a satellite and street map. You can swipe between the two maps by using the slider control at the top of the map. CSS Filter also contains a number of controls which allow you to adjust the brightness, contrast, saturation and hue of the road map. You can also add a blur effect and invert the colors.

The map uses CSS filters to adjust the colors of the road map. CSS filters provide an easy way to adjust the colors of your map tiles if you can't be bothered with the sometime arduous task of creating your own map style.

Tuesday, June 09, 2015

Leaflet Distance Scale


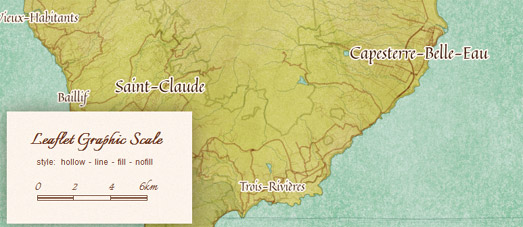
The Leaflet mapping library does already have a scale control, which shows the scale of the current center of the map in metric (m/km) and /or imperial (mi/ft) systems. However, if you want a scale with more customization options, you can also use the leaflet-graphicscale plug-in.

This distance scale plug-in for Leaflet allows you to add an animated distance scale to a Leaflet map with a number of different style options. The basic options allow you to add a scale with a number of fill options for each measurement unit, You can view how these options look by adjusting the settings on this demo map.

You can also edit the css styles of leaflet-graphicscale to change the font family and font size used in the scale. If you're happy with JavaScript, you can also play with the leaflet-graphicscale JavaScript code itself to adapt the plug-in to display other measurement systems (e.g. create a scale which shows distance in smoots).

Thursday, April 23, 2015

Choropleth Transitions in Leaflet

Fancy effects for your map applications with CSS is a series of CSS tricks which you can apply to Leaflet maps. Most of the CSS effects in the series are applied to the map when the user pans or zooms the map and (in my opinion) don't really add much to the user experience.

However I do really like the first example, which uses Fill Color Transitions, to create a nice transition effect between two different choropleth layers.

See the Pen emqoOX by moklick (@moklick) on CodePen.

As you can see in the embedded map above the CSS fill transition creates a nice fading effect to the choropleth polygons when the user switches from one choropleth layer to another. It is a rather nice looking effect and well worth the effort of adding only one line to your style sheet.

Tuesday, April 07, 2015

Satellite Mapping the Antarctic


Leafarctica is an interactive map which allows you to view NASA MODIS satellite imagery of the Antarctic.

The map includes a polar view which would be impossible with the usual Web Mercator projection used by most interactive mapping platforms. Leafarctica therefore uses the Proj4js JavaScript library to enable Leaflet to display an Antarctic Polar Stereographic projection.

The map includes a date input field which allows you to change the Antarctic satellite image displayed on the map by date.

Saturday, March 28, 2015

Canvas Masking in Leaflet


Democracy Street is a really interesting map which reveals the etymology of UK streets that have been named after UK politicians. One clever design feature of the map is the use of a masking effect to highlight interactive areas on the map.

All of the featured roads & streets on the map are colored yellow. However the yellow roads on the map don't show up so well when the map is zoomed out. To overcome this Democracy Street has used the leaflet.maskcanvas plug-in to highlight the areas around each featured road, ensuring that the interactive roads & streets can be easily spotted, even when zoomed out on the map.

The leaflet.maskcanvas plug-in is designed to show large data-sets on a Leaflet map. The plug-in effectively masks areas on the map except for the data points which you have added to the map. The leaflet.maskcanvas plug-in on Github includes an example map which uses the masking effect to show the radius around Berlin stations. The demo allows you to adjust the radius of the mask by any number of meters.


You can create a similar effect on Google Maps by using Vasile Cotovanu's polygon masking library. Geomask allows you to simply draw around an area on Google Maps and generate any shaped polygon to create a neat masking effect. You aren't restricted to one area and you can highlight as many areas as you want on the map.

Wednesday, March 18, 2015

The Living, Breathing Map


Vector Map is an amazing map of the world, complete with 3d extruded buildings and roads with animated traffic. The screenshot above doesn't do this map justice and you really need to view the map yourself in a WebGL enabled browser.

The map was built with Mapzen's Tangram mapping engine. Tangram is a library for creating 2D & 3D maps with WebGL. The Vector Map includes Tangram's extruded 3d building footprints and adds animated traffic to the map's roads.

Tuesday, February 24, 2015

Iceland's Rival to Street View


Iceland's telephone and business directory company Já has released 360° panoramic imagery of the country's roads.

Já maps uses Samsýn map data with the Leaflet mapping platform. If you select the '360' link in the map menu the availability of Street View is displayed on the map with blue lines. The coverage rivals Google Maps Street View coverage in Iceland, with 360° panoramic imagery available in towns and cities and all major roads.


The date that the imagery was captured is displayed in the bottom right-hand corner of the map. Most of the imagery seems to date from August 2013. Most of Google Maps Street View imagery dates from the same time.


In fact we know that the Google Street View car and the Já maps car were on the streets of Iceland at the same time because the two cars were busy capturing photos of each other. Street View Fun managed to find this scene, where the Já maps car is happily following along behind the Google Street View car, while they both capture their panoramic imagery of Iceland (and each other).

Saturday, February 14, 2015

Where's Pierre?


Hide a token in this picture map and you could win a trip on a hot-air balloon.

I think the objective of this Leaflet based game is to find a token hidden within this drawing of a theme park. Magical Mystery Zee consists of a hand-drawn picture of a theme park which has been turned into an interactive map.

You need to pan and zoom into the picture to try and find the hidden token. When you find the token you then get the opportunity to hide it yourself somewhere in the picture map. A timer in the bottom left-hand corner of the screen shows how much time has passed since the token was last found.

The ultimate winner of the competition will be the player who manages to hide the token for the longest time. The competition is open until the 27th February and you need to be a resident of France to win the prize.

Friday, February 13, 2015

The Freestyle Drawing Map


Baaam.international is a fun Leaflet map which allows you to draw on a blank map. Actually the map isn't entirely blank as you have to share your canvas with other artists signing-in from around the world.

The map includes four tools. The main tool is the drawing tool. Once you have zoomed into a blank section of the map you can select the 'draw' tool to start drawing on the map. When you have finished your sketch, if you like what you have drawn, you can select the 'share' button to grab a URL which provides a direct link to your drawing on the map.

Friday, February 06, 2015

The Jurassic World Interactive Map


The renowned Jurassic Park entertainment complex has rejected the Google Maps API in favor of the upstart Leaflet.js mapping library. When the world's favorite dinosaur inhabited theme park decided to create a new online map for Jurassic World they turned not to the mammoth Google brand but instead chose the Microraptor like independent mapping platform of Leaflet.

The Jurassic World Map is a custom designed, oblique view, interactive map of the world's latest, and some say most exciting, theme park. Visitors to the park can use the
map to find the location of hotels, restaurants, rest rooms and all the park's best rides and shows.

With the Jurassic World Map you have no excuse to get lost when visiting the park. In fact the only thing missing from this map is the location of the emergency exits - and I'm sure you won't be needing them.

Saturday, January 31, 2015

Maps Styles for Maps


If you are looking to pimp your online maps you could consider using one of the many custom designed map tile sets already in existence. Companies such as Stamen, Mapbox and CartoDB have created many wonderful examples of custom designed map tiles.

Luckily most of the popular map providers use the same tileset URL scheme. So adding a different map tileset to your project is fairly straightforward, as long as you know the URL for the tileset you wish to use.

Map Tiles Viewer is a collection of ten of my favorite map tilesets. Using the map you can browse through some of the best existing custom map tiles. Each of the map styles is accompanied by the map tileset's URL scheme. So if you want to use one of these styles you just need to cut & paste the provided URL.

Before using any of these tilesets you should check the provider's usage conditions and, if you do use one, make sure that you include the correct attribution.

Tuesday, January 27, 2015

1950's Birds Eye View


I've always really liked the oblique Bird's Eye view available on Bing Maps. I really love these 1950's bird's eye view photos of Glasgow, Scotland.

Glasgow Aerial Photos is a Leaflet map showing the location and the direction of the view of 159 historical aerial photographs of Glasgow. The photos were taken sometime in the 1950's or 1960's by the Glasgow Corporation Planning Department.

If you click on the link on any of the historical photographs another Leaflet map will open showing just the selected photo. You can then zoom in and pan around the photo to inspect it in greater detail.


Luckily Bing Maps has great Bird's Eye view imagery for Glasgow. So, with a bit of detective work, it is possible to discover the same views depicted in the Glasgow Planning Department photos as shown on Bing Maps and compare the two. The Bing Maps oblique view above shows almost the exact same view of Glasgow city center as the photo at the top of this post (click on the screenshot to visit the view in Bing Maps).

If you want to create your own Leaflet map using images or photos then you should have a look at Bjørn Sandvik's tutorial Showing Zoomify images with Leaflet. In the tutorial Bjørn explains how Zoomify can easily be used to create map tiles from any image. Using Zoomify and Leaflet it is therefore possible to turn any photo into a fully interactive digital map.

Thursday, January 15, 2015

The Amazing Self-Drawing Map


Sketch Map is a clever interactive map which uses D3.js and Walkway.js to sketch a road map one little bit at a time. Zoom in and out on the map or pan around and you can observe how the roads and transit lines are sketched out in real-time.

When I first saw the map in action my initial thoughts were '... this is very clever. Not very useful ... but very clever'.  However, thinking about this a little more, I can see some possible uses for this. You could possibly use the animated drawing function to animate the drawing of a route on top of a map.

You could also use this technique to add different layers to a map. For example, you could give users the option to add building footprints to a basic road map. When this option is selected you could then sketch the footprints onto the map using the sketchcart technique.

If you want to have a play around with this yourself the code for Sketchcart is available under an MIT license on Github.

Thursday, January 08, 2015

Leaflet Libraries


Leaflet is a wonderfully lightweight mapping platform. However the functionality of the platform can be extended by using any number of third-party plugins. The documentation for Leaflet includes a great list of some of the available third-party plug-ins. Here are a few more that you might find useful.

Leaflet.draw is a vector drawing and editing plugin for Leaflet. The library adds a drawing toolbar to a Leaflet map. The toolbar allows users to then add markers and draw polylines, polygons, circles and rectangles on the Leaflet map. Leaflet.draw is included in the plug-in list in the Leaflet documentation but I've also included it here because of the Leaflet.Toolbar plug-in.

Leaflet.Toolbar is a plug-in which allows you to build and add a flexible and extensible toolbar to a Leaflet map. Leaflet.Toolbar extends the Leaflet.draw plugin to enable custom user interactions. You can view an example of Leaflet.Toolbar on this map.

Leaflet List Markers is a handy library for providing a dynamic menu for all the markers displayed in the current map view. When users adjust the map view the menu automatically updates to list only the markers in the new map view.

Leaflet.TransitionedIcon is a plug-in that allows markers to be eased in and out of view on a map. The library allows you to fade markers on and off a Leaflet map. You can see the marker transitions in use on this demo map.

Mapbbcode has developed a large number of plug-ins for Leaflet. These include L.LetterIcon (round markers with text inside) and L.FunctionButtons (add buttons to a map to invoke JavaScript functions).