Friday, December 30, 2022

A Little Map Fun x 3

If you want to celebrate New Year's Eve in style then you should boogey on down to the Map Disco. The animated GIF above really doesn't do Map Disco justice - because this GIF is missing sound. Visit Map Disco yourself and you can watch the countries of the world lighting-up to the amazing sounds of the Bee Gee's classic 'Staying Alive'.

Slightly more ambient sounds can be enjoyed on Steve Attewell's Camera Lens Effect map. This interactive map presents a view of the world as seen through the lens of a camera (complete with raindrops hitting the lens). But that's not all. The Camera Lens Effect map also comes with ambient sounds. Zoom-in on the map and you can hear the sounds of the city streets. Zoom-out and you begin to hear more natural sounds, such as the noise of the jet stream. 

Even more map fun can be found on the Kaleidoscope interactive map. This map stitches together a number of different map views (flipped & rotated) to create a psychedelic map kaleidoscope. If you open the control panel you can even adjust the number of map instances used in the kaleidoscope.

Thursday, December 29, 2022

The 50 Best Maps of 2022

Maps of the Year is my round-up of the top 50 interactive maps of 2022.

The maps listed in this round-up are the 50 interactive maps which made the biggest impression on me over the last 12 months. As such they probably reflect my personal interests as much as they do any developing trends in digital cartography.

I am struck by how many 3D maps of historical monuments or places appear on my personal Maps of the Year list. Some of these reconstructions might even be considered more 3D models than 3D maps. The preponderance of these reconstructions or maps of historically important locations reflects my own interest in digitally reconstructing lost locations and being able to virtually visit world hertitage sites.

If I was forced to choose my own personal favorite map of the year I would choose Getty's amazing 3D reconstruction of an ancient lost city, Persepolis Reimagined. For years I have dreamt of being able to virtually walk around digital reconstructions of ancient Rome,  Pompeii, medieval London, or gold-rush era San Francisco. Persepolis Reimagined proves that it is now possible to actually create fantastic digital models or maps of historically important locations and cities.

Unlike Persepolis some fantastic artefacts from ancient history still survive. The Pyramids Of Meroe and Digital Giza use 3D modeling, photogrammetry and panoramic imagery to provide incredible 3D virtual tours of globally important historical monuments that very few of us will ever get to visit in person. Both of these virtual tours came very close to pipping Perspolis Reimagined as my personal Map of the Year.

My favorite map of 2021 was Sam Learner's River Runner. It is no surprise to me that his River Runner Global Edition also features on this year's round-up of the best interactive maps.

And, if you are suffering from an extreme case of epistemological shock at all the non-maps in my list of the Best Maps of 2022, then you might want to visit Kenneth Field's selection of his Favorite Maps of 2022.

Friday, December 23, 2022

Mapping Street Orientations

The animated maps above compare the extreme grid like layout of Chicago to the more organic street layout of London. As both maps move the attached compass roses update to show the orientations of all the roads in the current map bounds. 

The two maps were taken from The Economist's The Decline of the City Grid. This article also includes an interactive map which allows you to enter the name of any town or city to view a compass rose visualizing the location's predominant street orientations.

The Economist's article acknowledges its debt to Geoff Boeing's work on Comparing City Street Orientations, in which he compared the street orientations of 100 cities around the world. Geoff's study and his compass rose visualizations of predominant street orientations also inspired Mapbox's Vladimir Agafonkin to create his interactive Road Orientation map.

I suspect that The Economist has reused Vladimir's road-orientation-map code. I have used Vladimir's code myself many times (for example to map airport runway and church orientations). The code is very easy to adapt for different map features. I explain a little how you can adapt the road-orientation-map code in this post The Streets and Avenues of New York (which uses the code to just show the alignment of all the roads named 'Avenue' and  all the roads named 'Street' in New York).

Thursday, December 22, 2022

The A-A Christmas Quiz

Today I've been preparing my contribution to the annual Clarke Family Christmas Quiz. My map quiz requires you to name 8 countries based on each country's map outline. The name of each of the 8 countries begins and ends with the letter 'A'.

Although there are only 8 countries to name and although you know the first and last letter of each country I think this quiz is still very difficult. If you need a little help then this Wikipedia list of countries beginning with the letter A might be useful.

America, Antarctica, Africa, Asia, and Antigua (& Barbados) are not the answer to any of these country maps.

If the image above is a little unclear or if you want a print-out then you can download a PDF of the quiz - A to A (PDF file download).

The country border outlines for the quiz all came from World countries in JSON, CSV and XML and Yaml.

Disclaimer: I've definitely seen someone else mapping all the countries in the world which begin and end with the letter 'A'. Unfortunately I can't remember where I originally saw this. It could well have been one of the maps created for this year's #30DayMapChallenge. 

Mapping the Ancient Silk Route

The China National Silk Museum has created an interactive map which plots the technological advances in silk production over a period of around 6000 years. The Jinshow World Silk Interactive Map is the pilot project of a planned Interactive Atlas of Silk Roads. The initial world silk map plots the locations of over 12,000 artefacts related to the technological evolution of the production of silk and allows users to explore the development of materials and techniques in silk production over 6,000 years history.

The main Jinshow World Silk Map shows where archeological artefacts related to the production of silk have been discovered. These artefacts may be related to the developing technologies used in the production of materials, dyes and fibers. The map includes an interactive timeline which allows you to filter the archaeological discoveries by date.

The Jinshow World Silk Map also includes a number of maps exploring the Spatio-Temporal Evolution of silk production. This consists of four separate maps which plot the evolution of 'fibers', the 'primitive loom', the 'treadle loom' and 'dye'. These four maps all include a timeline navigation control which you can use to view the chronological development of these four separate areas of silk production.

Wednesday, December 21, 2022

Santa's Map of the World

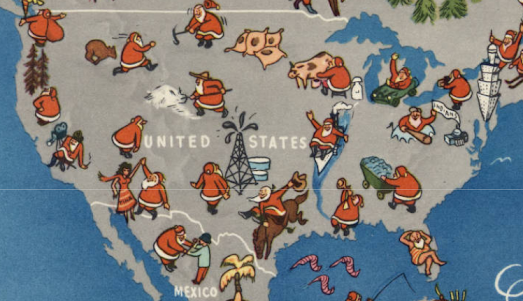
A World of Good Wishes at Christmastime is a pictorial map which was published by the General Drafting Company in 1950. The map shows Santa Claus participating in a range of 'local' activities around the world. 

As you might imagine the map relies on a number of perceived Western stereotypes. For example in Scotland Santa is depicted playing the bagpipes, in Australia he is seen boxing with a kangaroo, in India he is charming a snake and in Spain he can be seen fighting a bull. 

The General Drafting Company was one of the three big road map publishers in 20th Century America. They were the exclusive publisher of maps for a number of oil companies. The map 'A World of Good Wishes at Christmastime' however appears to have been published under the General Drafting Company's own name and I imagine was produced to promote the company and perhaps to be sent to customers and prospective customers as a kind of map themed Christmas Card.

My interactive version of A World of Good Wishes at Christmastime was created using the IIIF Manifest of the copy of the map owned by the American Geographical Society Library Digital Map Collection at the University of Wisconsin. You can also view an interactive version of the map on the library's website.

Another fun Christmas themed map is the Smithsonian Folkways Holiday Music Map. This musical map is bursting with traditional holiday music, featuring songs from the the museum's Folkways Recordings collection. 

The map includes 56 songs in total from 24 different nations. These are songs which celebrate the winter holidays, whether that be Christmas, Chanukah, or Kwanzaa. Using the map you can listen to an Icelandic version of 'Silent Night', 'O Tannenbaum' from Germany, 'Psalm 150' sung by the Jewish Abayudaya congregation in Uganda or traditional Christmas songs from many other country's across the world.

Every Christmas Eve you can track Santa's journey around the globe on Google's annual Santa Tracking map. However you don't have to wait until Christmas Eve to visit the Google Santa Tracker. Every day, between now and Christmas Eve, the Google Santa Tracker will feature a different Christmas related game.

The Google Santa Tracker also includes a Google Map looking at Christmas Traditions across the world. It is always fascinating to explore how different cultures celebrate Christmas around the globe. For example did you know that in Iceland the Christmas Cat prowls the streets at Christmas gobbling up anyone who is not dressed-up in clothes warm enough to ward off the winter cold?

Tuesday, December 20, 2022

Mapping Segregation in the United States

Yesterday the Washington Post published an article exploring the lasting legacy of racial covenants. These 'racial covenants' were clauses which were written into property leases or deeds prohibiting them from being sold or rented to people not "of the Caucasian race." The article Historians Mapping Racial Covenants links to interactive maps created by Montogomery County Planners, by the University of Minnesota and in Washington DC.

The University of Minnesota's Mapping Prejudice includes an animated map which shows the spread of covenants over time in the city of Minneapolis. The 'timelapse' map shows the growth of the number of buildings in the city placed under racial covenants from 1911 to 1954. As the map plots covenants added through time you can see how whole neighborhoods are essentially segregated as more and more buildings in the city are given racial covenants.

Mapping Segregation in Washington DC is an interactive map which visualizes all the homes in the capital which have had racial covenants. The project has also created a number of story maps which explore in more detail the impact and historical legacy of racial covenants in the city. 

The Planning Commission of Montgomery County has also produced an interactive map which explores both historic redlining and the use of racial covenants in the county. Their Mapping Segregation Project looks at the history of segregation in Montgomery County. The project hopes to "explain how ... institutionalized and systemic actions led to the inequitable development of Montgomery County." The current interactive map is a working draft of this ongoing project to map the county's racial restrictive covenants and HOLC loans (redlining).

You may also be interested in:

Monday, December 19, 2022

The American Illiteracy Map

ProPublica has mapped out the levels of adult illiteracy across the United States. 23% of adults in the United States struggle to read. However the levels of adult illiteracy are not the same across the whole country. Because the U.S. has one of the most unequal education systems of industrialized countries race and income have a huge impact on adult literacy rates.

An interactive map in the article Why America Fails Adults Who Struggle to Read shows the percentage of the adult population who struggle to read in every county in the country. The map shows quite a stark north-south divide. The black belt and southern Texas particularly stand out as areas with very high levels of adult illiteracy.

The ProPublica article focuses on how adult education is failing to address America's poor literacy levels. Much of this is due to systemic failures in an adult education system which prioritises advanced students and is less interested in providing literacy education. 

Part of the geographical differences in adult literacy may also be due to the variations in state funding for adult education. The ProPublica article lists each state's funding level for adults per eligible adult. Connecticut tops this list with $149 per eligible adult. Nebraska has the lowest level of funding for adult education with just $2 per eligible adult (although Nebraska appears to have comparitively low levels of adult illiteracy - with most counties falling far below the 23% national average of adults struggling to read).

Saturday, December 17, 2022

Scrolling the Mekong River

Reuters has created a very impressive scrollytelling map which is being used to illustrate how dams are having a devastating impact on the farms and livelihoods of people living on the Mekong River Delta. 

In How Dams Starve the Mekong River of Vital Sediment Reuters explores how the construction of hydroelectric dams has blocked the flow of sediment in the Mekong River. Sediment which is needed to provide nutrients for the rice farms along the delta. These rice farms help to feed up to 200 million people across Asia.

An impressive scrollytelling map is used to show the location of operational dams and the dams which are planned to be built in the future. As you scroll through the article the map scrolls down the Mekong River, while small info windows provide information on the hydroelectric dams and their devastating impact on those who rely on the river and its floodplains for their livelihoods. 

As you scroll along the river you travel from Tibet, through China, Laos, Thailand, Cambodia, and Vietnam to the South China Sea. Because of the Chinese-built hydroelectric dams only about two-thirds of the silt which once flowed into the Mekong River Delta is now arriving. In 2007 around 143 million tonnes of sediment reached the delta. It is estimated that at the current rate of decline less than 5 million tonnes will reach the delta annually by 2040. 

Friday, December 16, 2022

The Average Color of the United States

The map above shows the color of soil across the United States. The image comes from the University of California's Soil Properties map, which shows the color of moist soil at different depth levels across the whole country. 

Soil color can tell natural scientists a lot about a landscape’s recent and long-term history. It can also provide clues about mineralogy and about where organic matter has accumulated. The color of the soil can also help scientists determine what types of soil can be found at different locations.

The Soil Properties map doesn't only show the color of moist soil at different depth levels. The interactive map also includes many other map layers which provide information on the chemical properties of soil across the United States, information on soil depth & erodibility, and the sand, silt and clay properties of the soil.


The animated map above shows the average color of the USA throughout the year as derived from Sentinel 2 satellite imagery. The map was created by Erin Davis. If you visit Erin's post the Average Seasonal Color of the USA you can view 35 separate maps showing how the average colors of the USA change over the course of a single year.

Erin has also published a series of interesting maps showing the average colors of countries around the world based on Sentinel satellite imagery. The Average Colors of the World includes maps of each continent and a map of the world on which each country is colored based on its average satellite color.