Monday, November 28, 2016

Mapping London's Winter Wonderland


If you are visiting London this winter you can look forward to ice skating at Somerset House, the Christmas market on the South Bank, the Christmas tree in Trafalgar Square and the Christmas lights decorating Oxford Streets.

London Covered by glh Hotels is a nice interactive map of things that you can see and do in London this winter. It is also a clever way of marketing glh's London Hotels. The map shows the locations of London's special winter events, ice skating rinks and winter markets. It also shows the location of some of the best stores to visit to complete your Christmas shopping.

As you browse the map you can add any of the points of interest that you fancy to your own personal itinerary. You can, of course, also book your stay in any of the featured glh hotels.

The map itself is a nice custom designed map with neat illustrations of the featured points of interest. The custom map has been made interactive using the Mapplic mapping library. Mapplic is a mapping library which is particular effective in creating interactive maps from your own custom made maps or images.

Sunday, November 27, 2016

How to Map Your Videos


You might have seen the Scottish Mountain Biking Trails map, featured earlier this week on Maps Mania. Scottish Mountain Bike Trails provides video tours of Scottish mountain bike trails, in which each video is synchronized to a Cesium map. This means that as the headcam video of a trail plays you can follow the action on a map of the same trail.

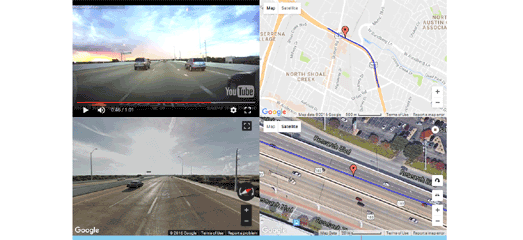
If the Scottish Mountain Biking Trails map has inspired you to think about mapping your own videos then you might want to have a look at Map Channel's new Video Maps creation tool. Using Video Maps you can easily create your own video journey map, in which your video is synchronized to a Google Map,

To create a Video Map you need to have a YouTube video of a journey or trip. You also need to have a GPX file of the same journey in order to map the locations in the video to the Google Map. If you have the video and the GPX file you just need to share them with Map Channels and Video Maps will do all the rest.

Your finished Video Map includes your video, two different Google Map views (map & oblique 'Bird's Eye' view), Street View and an elevation chart. When you press play on the video the two maps and the Street View automatically update to show the current location in the accompanying video.

Saturday, November 26, 2016

The Occult Map of London


Throughout history the streets of London have been haunted by a number of ghoulish figures. In the nineteenth century the fire breathing, metal clawed Spring-Heeled Jack would stalk the streets of South London attacking helpless pedestrians. In the twentieth century it was the Vampyre of Highgate who stalked the grounds of Highgate Cemetery.

You can learn more about London's ghoulish past on History Today's mapped Guide to Occult London. The guide uses Knightlab's StoryMapJS platform to tell the stories of the people, myths, and places in London’s occult history. Many of the examples of occult locations on the map also feature links to previous articles on the subject on the History Today website.

If your heart can take more frightful tales of London then you might also like Grim London, an interactive map plotting and recounting the history of some of London's most spine-chilling events and apparitions.

Friday, November 25, 2016

Mapping the Universe


The Gleamoscope interactive map allows you to explore the Milky Way across the range of electromagnetic frequencies. It allows you to view the night sky in a way that isn't visible to the naked eye.

Humans can only see a very small part of the electromagnetic spectrum (visible light). Astronomers therefore use telescopes that are able to detect different parts of the electromagnetic spectrum. Gleamoscope allows you to view the results of the all-sky survey from the Murchison Widefield Array telescope in Western Australia. The different electromagnetic frequencies are represented on the map using false colors, representing the data from wavelengths we can’t see as colors that we can see.

If you right-click on a location on the Gleamoscope map you can view the selected part of the Milky Way in more detail on either the Wikisky or WorldWideTelescope interactive maps.

Thursday, November 24, 2016

The Homeless of LA


In January the Los Angeles Homeless Services Authority carried out a survey of the homeless in Los Angeles County. The survey estimated that there were 44,359 homeless living in the county, which is an increase of 12% since 2013.

The Los Angeles Times has released a dot map from the survey, revealing the distribution of homeless people throughout the county. Each dot on the Where are L.A. County’s Homeless? map represents one homeless person or a makeshift shelter or vehicle occupied by the homeless.

The dots do not represent the exact location of homeless people in the county but are randomized throughout each census tract. If you select a census tract on the map you can view a breakdown of the number of homeless counted in the neighborhood.

You can read more about the census and its results in an accompanying LA Times' article L.A. County has its most accurate count yet of its homeless population.

Mapping Car Accidents in Birmingham


The Open Transport EU Car Accidents map is a visualization of 28,519 car accidents in the UK city of Birmingham. The map uses Open Transport EU's own WebGLayer JavaScript library for exploring coordinated multiple views of location data.

As well as the heatmap the Open Transport EU Car Accidents map includes a number of interactive graphs which show the number of car accidents in the city by day of the week, time of day, severity of accident, the speed limit and by date.

Each of these graphs can also be used to explore the data in detail. Using the graphs to filter the results shown on the map means that you can view accident hot-spots in Birmingham by time of day, day of the week etc.

Wednesday, November 23, 2016

Thank Sampson County this Thanksgiving


If you live in North Carolina there is a good chance that your Thanksgiving turkey comes from Sampson County. According to the USDA farm census Sampson County sold 16,394,921 turkeys in 2006.

If you want to know where your turkey, sweet potatoes, green berries and cranberries were raised or grown then you should browse Esri's Where Did Your Thanksgiving Dinner Come From? interactive map. To find out where America's Thanksgiving foods come from just select one of the foods from Esri's Thanksgiving plate. You can then view a map showing where that food is raised or grown across the United States.

This Thanksgiving America will consume around 250 million turkeys, millions of barrels of cranberries and hundreds of thousands of acres worth of green beans. Smithsonian created this interactive map so that you know who to thank for your Thanksgiving meal.

Mapping Montreal's Hot Spot of Crime


The Rue Sainte-Catherine Ouest is the robbery center of Montreal. At least that is one conclusion that can be drawn from a new interactive crime map of the city.

Vue Sur la Sécurité Publique is an interactive map of crimes reported to the police in Montreal since the beginning of 2015. The map allows you to view the locations of a number of different crimes that have been reported to the police over the last two years.

Using the map's filter controls you can select different date ranges and also view different types of crime on the map. If you select to view only the crime of theft ('vol qualifie') the map reveals a distinct hot-spot of crime all along the Rue Sainte-Catherine Ouest.

One of the dangers of crime maps is that neighborhoods and streets may be stigmatized as hot-spots of crime based on inaccurate data The accuracy of crime data depends on a number of different factors, including victims actually reporting crime, the police accurately recording the data and the data being accurately plotted to the correct location.

The danger of errors in mapping crime was highlighted in this Seismograph San Francisco Bike Theft Map. While creating a map of bike thefts in San Francisco Seismograph found that 850 Bryant Street was a curious hot-spot of bike crime in the Californian city. It turns out that 850 Bryant Street is actually the address of a police station. Stolen bikes with no location data were simply plotted by the police to the address of the reporting police station. 850 Bryant Street is therefore the bike theft equivalent of Null Island in San Francisco and not a real hot-spot of stolen bikes.

It is entirely possible therefore that the Rue Sainte-Catherine Ouest in Montreal is not a cesspit of crime. I strongly suspect that the curiously large number of thefts on the Rue Sainte-Catherine Ouest is a result of an anomaly in the way that crime is reported to or recorded by the police in Montreal.

Tuesday, November 22, 2016

Scotland's Mountain Bike Trails


Scottish Mountain Biking Trails uses the Cesium 3d mapping library to show the location of all of Scotland's mountain bike trail centers. The site also provides video tours of every single mountain bike trail on the map

If you select a marker associated with a mountain biking center on the map you can view details of the facilities available. Each route of a center's available mountain bike trails are shown on the map using colored lines. The colors of these lines indicate each trail's grade (based on the grades used in cross country skiing).

The killer feature of the Scottish Mountain Biking Trails map is the headcam video tours of each of the bike trails. If you click on a bike trail on the map you can watch a YouTube video of someone riding the whole trail. The video is synced to the map. This means that as the video plays the 3d map view animates to show you the current location in the video. If you select the video icon in the video window you can switch the video to full screen and the map to the smaller window (click it again to switch back to view the 3d map in the larger window).

Monday, November 21, 2016

Hiking with Street View


The Anacostia Tributary Trail System allows you to explore nearly 63 miles of hiking trails along and around the Anacostia River with 360 degree panoramic imagery. The map shows all the available trails in the system and allows you to virtually walk each and every trail with custom street view imagery.

The street view imagery includes a handy automatic play feature that allows you to take a virtual hike along any of the trails. After you have selected a trail from the main map you can just press the play button and sit back and watch as an animated tour takes you through all the available panoramic imagery. An elevation chart of the trail is shown along the bottom of the panoramic imagery. You can jump to any location in the trail by clicking on the trail's elevation chart.

The panoramic imagery for the Anacostia Tributary Trail System was provided by Terrain360. You can explore many other 360 degree panoramic image tours of trails throughout the United States on the Terrain360 website.