Showing posts with label Texas. Show all posts

Tuesday, November 30, 2021

Violent Conflicts in the Republic of Texas


In the early 19th Century Texas was one of the most diverse regions in the North American continent. It was home to a number of Native American tribes. It was also home to a large Mexican population and a growing number of illegal immigrants from the United States.

After the formation of the independent Republic of Texas in 1836 relations between Native Americans and Euro-Americans was often strained. The nationalist faction in the new republic led by Mirabeau B. Lamar, advocated for the expulsion of all Native Americans from Texas. Conversely some of the Native American tribes, such as the Comanches, opposed the new republic.

The University of Texas' Border Lands interactive map is an attempt to document and map the locations of the many incidents of conflict between Native Americans and Euro-Americans in Texas during the period from the creation of the First Mexican Republic to the outbreak of the U.S.-Mexico War (1821-1846). 

The interactive Border Lands map includes three main views. The Timeline view allows you to explore all the mapped sites of conflict by date. This timeline view includes a date control which allows you to filter the incidents shown on the map by date range. It also includes an animation view which adds all the sites of conflict to the map in chronological order. The Heat Map view provides a a visualization of the density of conflicts by location. This view provides an overview of which locations in Texas witnessed the most violent conflicts during the period 1821-1846. The Fatalities map view uses colored markers to visualize all the violent conflicts between Native Americans and Euro-Americans by the resulting number of deaths. 

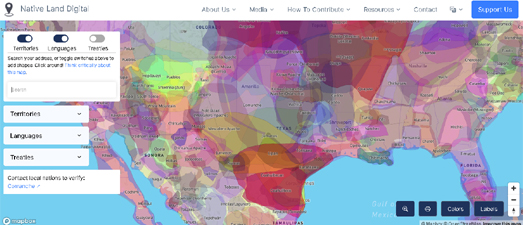
You can gain a deeper insight into the indigenous tribes which were native to the area now known as Texas on the Native Land interactive map. Native Land is an interactive map attempting to show the locations of indigenous territories, languages and treaties around the world.If you zoom in on Texas on the Native Land map you can explore which Native American tribes and languages were indigenous to the area before the arrival of Europeans.

Tuesday, October 05, 2021

Gerrymandering in Texas

This is a map of the Republican Party's proposal for TX-33, a congressional district in the city of Dallas. Last Monday the Republican-controlled Texas Legislature unveiled maps of how it plans to redraw Texas' political map. Under these proposals TX-33 will become probably the most gerrymandered electoral district in all of the USA, if not the world. It is a spectacular testament to the Republican Party's contempt for both democracy and the American people.

In Explaining the Most Bizarrely Shaped Districts in Texas’s Proposed Congressional Map the Texas Monthly explains the incredibly gerrymandered proposal for TX-33 very simply as an attempt to "pack non-Anglo voters into one district". The bizarre shape of TX-33 is a blatant attempt to pack possible Democrat voters all into the one district, in the process making marginal neighboring Republican districts much less marginal.It is an attempt at vote packing which can be seen all over Texas' proposed new political map.

In How Texas Plans to Make its House Districts Even Redder the New York Times has published an interactive map which shows the boundaries of all the proposed congressional districts in Texas and also visualizes the 2020 Presidential vote margin in each precinct. By overlaying the vote margin on top of the proposed new electoral districts the NYT clearly shows how the Republican Party is trying to pack Democrat voters into as few districts as it possibly can. 

The result is a political map which will contain some of the most bizarrely shaped electoral districts that Texas has ever seen. A map which is so gerrymandered and undemocratic that any politician supporting this map should by right be automatically barred from standing for office ever again.

Wednesday, February 27, 2019

Living and Dying in Texas


The average Texan can expect to live until they are 78.5 years old. Of course life expectancy in the state can vary dependent on where you live and your sex and race. Life Expectancy in Texas is an interactive map which allows you to see where people can expect to live longer or shorter lives in Texas.

Enter your zip-code into the map and you can view details on life expectancy in your neighborhood. The map sidebar will show the average life expectancy in your zip-code area and the average life expectancy in your county. The interactive map provides a choropleth view of the life expectancy in your area and in the surrounding neighborhoods. This allows you to see at a glance if the life expectancy in your neighborhood is dramatically higher or lower than your surrounding neighborhoods.

Three maps are shown. One shows the average life expectancy for the population as a whole. The two smaller maps show the average life expectancy for men and for women. Buttons at the top of the map allow you to view the average life expectancy for the white, black or Hispanic populations.

If you don't live in Texas you might prefer Quartz's U.S. Life Expectancy Map.


Where you live can have a huge influence on how long you can expect to live. People who live in New York's Chinatown have a life expectancy of 93.6 years. However people who live in nearby Roosevelt Island have a life expectancy of just 59 years. You can discover the average life expectancy in your neighborhood on this interactive map from Quartz.

Quartz's Life Expectancy Map reveals the average life expectancy in nearly every U.S. neighborhood. The map uses data from the Center for Disease Control's U.S. Small-area Life Expectancy Estimates Project, which tracks life expectancy at the census tract level. If you hover over your neighborhood on Quartz's map you will discover the average life expectancy in your census tract and how that compares to the state and national average.

The average life expectancy in the USA is falling. Between 2016 and 2017, the average life expectancy in the US fell from 78.7 to 78.6 years. The CDC blames this fall on the large increase in drug overdoses and suicides.

Thursday, May 24, 2018

The Spy Planes Spying on Texas


Last year Buzzfeed released an award winning investigation into the use of spy planes by the FBI and the DHS over mainland America. Buzzfeed's Spies in the Skies investigation mapped out the flight paths of the FBI and the DHS planes to reveal the areas where these federal planes have been spying.

The Texas Observer has now released a very similar investigation into the aerial surveillance carried out by the Texas Department of Public Safety (DPS). The Texas Department of Public Safety owns two high altitude spy planes.

In Eyes Above Texas the Texas Observer has used tracking data for the two planes, obtained from Flightradar24, to create a map of where the planes have flown. The Esri map shows all the known flight paths undertaken by both planes from January 1, 2015 to July 31, 2017. The map includes a closer view of all the places where the two planes might have flown into Mexico. Under the Department of Public Safety's own rules the planes are not allowed to fly over other countries.

The Observer has used DPS flight logs to color code the planes' flight paths to show those where the flight's purpose is for border security and those where the flights have another purpose. The Observer's map also includes a search facility. You can therefore enter your own address to see how often the DPS spy planes have flown over your house.

Monday, July 25, 2016

Mapping the UT Tower Shooting


Fifty years ago Charles Whitman killed 14 people and wounded 32 others at the University of Texas. The Texas Standard has interviewed nearly 100 survivors of the UT Tower Shooting, including professors, students and reporters. You can listen to the interviews and view archival newspaper reports & photos about the shooting on the Texas Standard's new Tower History website.

Out of the Blue: 50 Years After the UT Tower Shooting features a prominent interactive campus map of the University of Texas at Austin. Using the map you can listen to eye witness accounts of the UT Tower Shooting. As well as the audio files many of the markers include textual reports and archival photos.

The map itself is a really nicely designed custom map of the campus site. It has been made interactive using the Leaflet.js mapping platform.

Thursday, March 03, 2016

The Houston Hurricane Simulator


On September 11th 2008 the National Weather Service issued a severe warning to Houston residents,
ALL NEIGHBORHOODS, AND POSSIBLY ENTIRE COASTAL COMMUNITIES, WILL BE INUNDATED. PERSONS NOT HEEDING EVACUATION ORDERS IN SINGLE FAMILY ONE OR TWO STORY HOMES WILL FACE CERTAIN DEATH.
The warning was issued because of the imminent threat of Hurricane Ike, which at the time was heading directly towards central Houston. Luckily, on September 13th, Hurricane Ike shifted course and eventually hit land a little north of the city. The storm still caused $30 billion in damage and killed at least 74 people in Texas.

The Texas Tribune and ProPublica argue that it is only a matter of time before a perfect storm will hit Houston, potentially killing thousands of residents.

Hell and High Water is a mapped visualization of the dangers Houston faces from a future hurricane. The mapped interactive simulates the likely effects of a number of potential storms on the city of Houston. Each of these simulations overlays the track of a potential storm over a satellite view of the city. These tracks are then animated to show the likely flooding events that could take place in Houston if such a storm hit the city.

The Texas Tribune argues that not enough has been done to protect the city from potential future storms. Dr. Bill Merrell, a marine scientist at Texas A&M University, believes that the city needs to build floodgates at the entrance to Galveston Bay. He predicts something will be built - four years after the next devastating hurricane.

Tuesday, May 27, 2014

7,000 Texas Disposal Wells on the Map


The Texas Tribune has published a map showing the location of disposal wells where waste-water, often from hydraulic fracturing sites, is being disposed of in the state. Texas Disposal Wells visualizes the location of 7,000 disposal wells in Texas.

The map uses hexagonal binning to highlight the number of wells within an area.. You can zoom in on the map to view the location of the individual wells.

The Texas Tribune uses the Mapbox platform. Mapbox has written a nice tutorial on how to use hexagonal binning with Mapbox created maps. Binning: an Alternative to Pointmaps explains how the free and open source QuantumGIS tool can be used to create a hexagon density layer, which you can then overlay on top of a Mapbox map.

Friday, April 18, 2014

Where Could You Afford to Live in Texas?


The Texas Affordability Index is a handy mapped guide to where you can afford to live in Texas. To find areas in Texas where you could afford to rent a property simply select your job from the drop-down menu and the amount of space you wish to rent and the map will show you where you can and cannot afford to live.

The map allows you to enter a number of parameters concerning your income and living expenses, including your spouse's job and your food costs. A heat map of Texas is then displayed showing the areas where you can afford to live (in green) and the areas outside your income bracket (in red). You can also click on any area on the map to see how much disposable income you would have left (in affordable areas) or how much more income you would need to live there.