How to Make a Building Age Map
Earlier this month OpenStreetMap contributor SK53 posted an interesting tutorial on how to Color Code Buildings by Age in Overpass Turbo. The tutorial includes a link to this query in Overpass Turbo which when run will color all the buildings in the current map view by their year of construction.
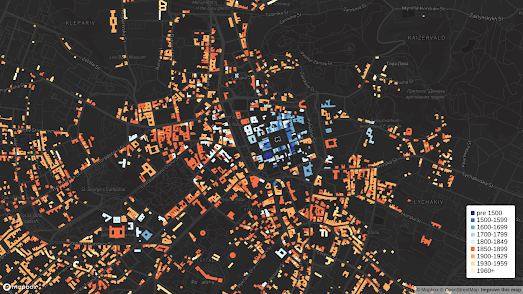
Using this query you can quickly view the age of buildings anywhere in the world. Unfortunately OpenStreetMap doesn't actually have much building age data in most locations around the world. This means that in many towns and cities only a few buildings will be colored on the map. Some cities however do have a lot of building age data. For example OSM editors in Lviv, Ukraine have used city data to add the year of construction to many Lviv buildings on OpenStreetMap.
This means if you run this query you can view a map of Lviv with the buildings color-coded by their year of construction. Press 'Export' and you can also download the data in GeoJSON format. Which is what I did to create my Lviv Building Age map.

To create this map I simply uploaded the exported GeoJSON file into MapBox Studio. I then used data conditions to style each of the building polygons in the GeoJSON file by the 'start date' for each building. So far the only thing that I have added to this map is a legend which shows the date range used for each color.
TO DO
1. Add some interactivity to the map - so that if you click on a building you can view its actual year of construction. If you now hover over a building footprint its year of construction will be displayed on the map.
2. Add interactivity to the map legend so that you can filter the buildings shown on the map by date range.


Comments