Coastline Paradox uses Google Maps Street View imagery to visualize how rising sea levels are likely to affect locations around the world over the next three hundred years. The map was created by Finnish artists Pekka Niittyvirta and Timo Aho to provide a powerful visualiztion of likely sea level rises and their effects on global migration.
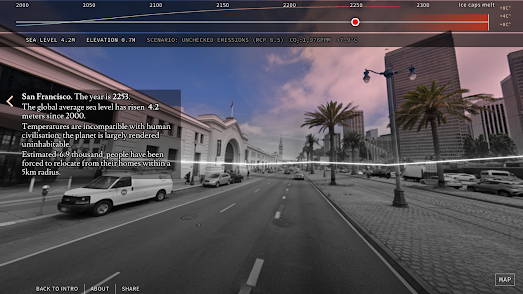
Using Coastline Paradox it is possible to view the likely effects of rising sea levels at locations around the world for any year between now and 2300. Select one of the global locations marked on the map with a blue dot and a panoramic Street View image will appear. Superimposed on top of this image is a glowing white line which shows the likely future sea level at that location. You can adjust the date for the sea level prediction at any location by using the timeline control above the map.
A text box is also superimposed on top of the Street View image informing you of the year displayed, the number of feet that the sea will have risen by that date and the number of people who will likely have been displaced at the selected location by the rising sea level. The sea level rises displayed on the map are based on the Intergovernmental Panel on Climate Change’s (IPCC) Special Report on the Ocean and Cryosphere in a Changing Climate (2019).
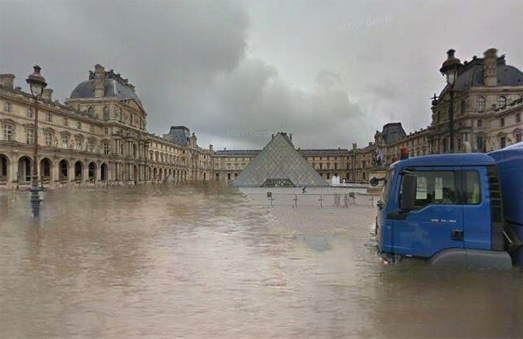
It is possible to make a sea level rise visualization a little more realistic by using AI to add a little water to a Street View image. Foe example, the picture above shows how the Louvre art gallery might appear after global sea level rises have flooded Paris. This imagined view of the Louvre was created by ThisClimateDoesNotExit.
ThisClimateDoesNotExist is a clever Google Street View based application which allows you to see how your house might look after your street has flooded. To create an imagined view of your flooded house you just need to type your address into ThisClimateDoesNotExist's Google Map. If Google Street View imagery is available at this address you can then view an 'AI' generated image of your home under a few feet of water.
ThisClimateDoesNotExist claims to be "an AI-driven experience based on empathy". What this means is that the application does not use any real rising sea level predictions to picture your house under water. It just portrays an imagined scenario. As long as the user is clear that the enhanced Street View image isn't based on any real climate change science then the generated picture of an address can have a strong emotional impact. Nobody wants to really see their home flooded by rising waters.
I suspect that both Coastline Paradox and ThisClimateDoesNotExist have used the GSVPanoDepth Street View depth library to visualise sea level rise in such a powerful way.

Almost 20% of Singapore is reclaimed land. The country is therefore very worried about the likely effects of rising sea levels. In order to illustrate the possible impact of sea level rise the Straits Times has created a virtual reality visualization called Singapore Underwater.
Singapore Underwater uses virtual reality to show how Singapore might look in the future if global warming leads to rising sea levels. Singapore Underwater explains the reasons why sea levels are rising around the world. The visualization also looks at how Singapore might try to mitigate against rising seas and the possible impact of land loss and saltwater contamination of the country's farmland & reservoirs.
Singapore Underwater is best viewed with a VR headset but it can be viewed on a desktop, tablet or mobile device.
The recent devastating floods in Pakistan and Australia have obviously led many people to wonder about how susceptible their homes are to flooding. One consequence of global heating and rising sea levels is that flood risks are increasing across the world and these kind of lethal floods are going to become much more common.
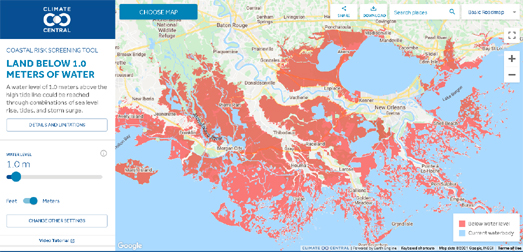
Climate Risk's
Coastal Risk Map allows you to view your risk from projected sea level rise and coastal flooding by year, water level, and by elevation.Share your location with the Coastal Risk Map and you can view the potential flood risk for different years and for different levels of sea level rise.


Comments