Showing posts with label marine. Show all posts

Thursday, August 07, 2025

Ocean Warming Stripes

These Ocean Warming Stripes show the alarming extent to which average global sea surface temperatures have risen in the 21st Century, compared to the norm of annual global temperatures dating back to 1850. In the visualization, each year since 1850 is represented by a colored stripe. The color of each stripe is determined by the average global sea surface temperature. As you can see, there has been a steady increase in global sea surface temperatures this century - and an alarming spike in temperatures in the last 3-4 years.

The oceans absorb over 90% of the excess heat caused by the greenhouse effect from our use of fossil fuels such as coal, oil, and natural gas. This ocean warming has far-reaching impacts: it disrupts marine ecosystems, bleaches coral reefs, intensifies hurricanes and tropical storms, and contributes to the melting of polar ice, which in turn raises sea levels. Additionally, warmer oceans can alter global weather patterns, threaten fisheries and coastal communities, and reduce the ocean’s ability to absorb carbon, further accelerating climate change.

Climate Central has released a series of tools designed to visualize the influence of human-caused climate change on ocean temperatures around the world. In addition to the climate stripes visualization shown above, there is a Climate Shift Index interactive map that 'shows how much climate change has affected the likelihood of a particular day’s ocean surface temperature across the world.' On this map, increases in sea surface temperatures are represented using red hues.

The use of climate stripes is a particularly powerful method of visualizing temperature increases over time. In 2018, Ed Hawkins, a climate scientist at the National Centre for Atmospheric Science at the University of Reading, released this innovative form of data visualization to illustrate how temperatures have risen around the globe over the last century. His clever Climate Stripes visualizations of global heating over time have quickly become a data visualization design classic.

Thursday, June 05, 2025

Mapping Whale Superhighways

The WWF has launched a new interactive map Blue Corridors that brings 30 years of whale migration data to life. Using the map you can:

🛰️ See where whales travel.

⚠️ Learn what’s putting them at risk.

💙 Discover how we can protect them.

The new Blue Corridors interactive map is designed to support global whale conservation efforts by visualizing decades of scientific data in a way that is accessible, actionable, and urgently relevant. At its core, the map transforms over 30 years of satellite tracking and research into a compelling, interactive experience that allows you to explore whale migration routes, pinpoint major threats, and examine conservation priorities across ocean basins. 

The map is built on 1,429 satellite tracks and over 3.2 million kilometers of migratory data and integrates inputs from more than 50 different research institutions. The platform overlays whale movements with human activities such as shipping, fishing, and pollution to identify high-risk zones, supporting data-driven decisions to mitigate threats like ship strikes and entanglements.

You can interact with the map by species, threats, or regions. The sidebar menu also includes links to news and stories about whale conservation, whale migratory routes and the threats to marine environments.

Friday, May 23, 2025

Underwater Weather Forecasts

Current Map by Current Map is a powerful tool for visualizing ocean dynamics. This interactive map uses animated streamlines to depict tidal currents in coastal areas of the United States, offering high-resolution, real-time, and forecasted ocean current data. It's a practical, visually striking resource for sailors, scientists, and anyone with an interest in the ocean’s ever-changing tidal forces.

Animated streamlines are often used on interactive maps to visualize real-time and forecast wind currents. This is the first time I've seen them used for actual water currents. The use of animated streamlines on a map was I believe first demonstrated on Fernanda Viégas and Martin Wattenberg's Wind Map. Cameron Beccario further developed the concept by utilizing animated streamlines on a fully interactive map in his popular Earth Nullschool visualization of global weather conditions.

Behind the scenes of Current Map, sophisticated physics models simulate real-world ocean conditions, taking into account factors like tides and wind forcing to produce accurate short-term forecasts. Users of the map can explore these tidal forecasts directly in their browser, or download GRIB files for use with navigation software, making the data accessible even when offline. 

Friday, May 09, 2025

The Marine Migration Map

tracked migrations of the Green Turtle

Migratory Connectivity in the Ocean (MiCO) is an interactive map visualizing the global migrations of more than 100 species of birds, mammals, turtles and fish. The aim of the map is to bring together knowledge about the migratory routes and connected habitats of marine species, such as marine mammals, seabirds, sea turtles, and fish, in order to help support global conservation efforts.

The MiCO map was compiled by synthesizing decades of animal movement data from over 1,300 scientific studies published between 1990 and 2017. To create the map researchers compiled satellite tracking data from 109 migratory marine species, including seabirds, whales, sea turtles, and fish, collected through animal-borne tags that record and transmit migration routes. These tracking studies, conducted by universities, government agencies, and conservation organizations, have now been aggregated, standardized, and mapped to show key habitats and migratory pathways. 

By bringing together data from over 100 species and 100 studies, MiCO highlights critical corridors and habitats that multiple migratory animals rely on, helping policymakers and conservationists prioritize protection in key areas, especially in international waters where governance is fragmented. It is hoped that MiCO can help foster cross-jurisdictional collaboration, support data-driven policy decisions, and help prioritize conservation actions in both national waters and international seas, where migratory species are most vulnerable yet least protected.

Explore more migratory journey maps through the animal tracking tag

Monday, January 27, 2025

Dive into Your Maritime History

satellite view of an historical jetty in the River Thames

The marine area of the UK has played a pivotal role in shaping the country's history. The seas surrounding the UK are home to a wealth of historical treasures, including submerged prehistoric landscapes, shipwrecks, crashed aircraft, and maritime industrial structures. Unfortunately the historical collections, which document these sites, are dispersed across various government organizations, universities, museums, and archives in England, Scotland, Wales, and Northern Ireland.

The Unpath’d Waters Portal is a new online interface that, for the first time, enables users to access these disparate marine collections through a single, shared, and cross-searchable online catalogue. By consolidating these diverse datasets in one place, the portal allows users to uncover and study underwater artifacts and sites more effectively than ever before.

How the Portal Works

The portal provides a wealth of information about the UK's maritime past, including data on shipwreck sites, maritime archaeology, coastal defenses, maritime structures such as docks and harbors, and more. It is designed to help researchers and the general public discover and explore the UK’s fascinating maritime history. 

One of the portal’s most exciting features is its interactive map. Users can zoom in on the map and search the collections by location. As you pan around the UK and its surrounding waters, the map automatically updates to display all markers within the current view. Clicking on these markers reveals detailed information about the selected historical features.

The map is an invaluable resource for discovering more about local maritime history. For example, this morning, I used the portal to explore the historical heritage of the River Thames in East London. I discovered several nearby historical sites that I plan to visit in person in the coming weeks.

Monday, December 23, 2024

Mapping Marine Traffic

map showing marine traffic off the north east coast of the United States

Esri's interactive map U.S. Vessel Traffic offers a captivating visualization of activity on U.S. waterways, underscoring the vital role marine traffic plays in commerce, travel, and environmental management. Over the past decade, vessel traffic in the U.S. has seen significant growth, with annual cargo shipments reaching 2.3 billion tons.

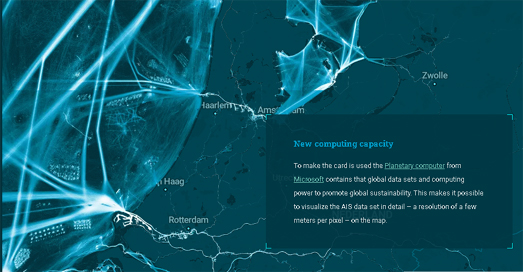
Esri's interactive map leverages Automatic Identification System (AIS) data to track and categorize various vessel types, including cargo, fishing, passenger, military, pleasure, and tanker traffic. Users can zoom into specific ports or regions to observe dense, bright tracks that illustrate common routes and congestion points. The map’s design is both visually striking and highly functional, featuring neon-colored ship tracks against a dark basemap to emphasize movement patterns. 

Customizable filters for vessel type and time period allow users to tailor their view, enabling trend analysis from 2015 to the present. Furthermore, the ability to download ship track data based on geographic and temporal parameters enhances the map's utility for marine researchers and planners.

global map of marine traffic

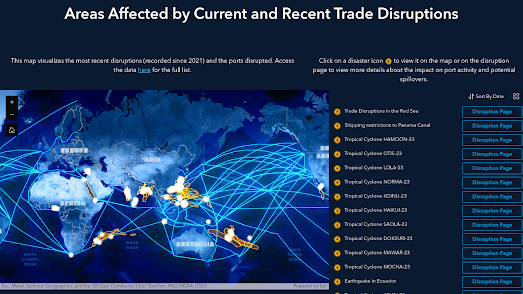
For a broader perspective MarineTraffic offers a global live map of major shipping lanes. The MarineTraffic tracking map includes an option to overlay a density map, which displays accumulated data on global shipping traffic over recent years. Activating the 'Density Maps' overlay reveals fascinating insights into the world's shipping activity.

Interestingly, gaps in the marine traffic density map can be just as informative as the recorded tracks. These voids may reflect global geopolitical influences (such as military conflicts), piracy threats, or localized shipping conditions.

animated map of marine traffic off the eastern seaboard of the United States

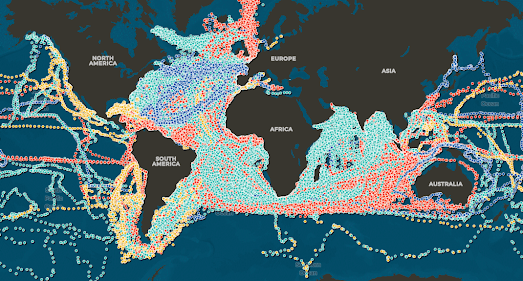
Another remarkable tool for exploring global shipping routes is Shipmap.org, an animated interactive map that visualizes the movements of the global merchant fleet over the course of a year. Using AIS shipping data from exactEarth, the map displays the movements of different cargo ship types throughout 2012.

Shipmap.org allows users to filter vessels by cargo type, offering a detailed look at various shipping patterns. The accompanying narrated tour highlights intriguing trends in the worldwide merchant shipping trade, making it a truly engaging resource for understanding the dynamics of global marine traffic.

Tuesday, September 10, 2024

Tracking Russia's 'Dark' Shadow Ships

Asya Energy's AIS track places it in the Norwegian Sea, at the same time satellite imagery shows it at the ALNG2 plant

In response to Russia's invasion of Ukraine the West has imposed sanctions on the sale of Russian oil. In an attempt to avoid these sanctions Russia has been operating a shadow fleet of covert oil tankers. The West has been working on strengthening international cooperation to try to limit the use of these covert oil tankers.

SynMax claims that Russia is also developing a 'shadow' fleet of Liquefied Natural Gas (LNG) tankers. In The Inception of Russia’s LNG Ghost Fleet SynMax maps out how a number of LNG tankers have been using AIS spoofing tactics in order to conceal their visits to Russia's Arctic-2 LNG Export Plant. (ALNG2)

At the same time as their spoofed AIS tracks show them supposedly in the Norwegian Sea a number of LNG tankers have been spotted on satellite imagery by SynMax actually at the ALNG2 plant 800 miles away. These ships are part of a dark fleet assembled by Russia’s Novatek to avoid sanctions imposed on transporting cargoes from ALNG2.

Alongside the AIS spoofing activity mapped by SynMax these ships also show a common pattern of frequent changes in ownership, vessel names and country registrations. All common tactics used by tankers trying to avoid sanctions on the sale of Russian oil and LNG. At least one ship has also been tracked taking the perilous sea route south through the Red Sea. SynMax speculates that "Russia may have negotiated a deal with Yemen’s Houthis ... allowing for “safe passage” through the Bab el Mandeb Strait". 

Tuesday, June 18, 2024

Where Mountains Rise From Oceans

an elevation heat map of Iceland showing OceanJut rankings

Last year PeakJut invented the Jut Score in order to rank mountains based on how sharply they rise above their surroundings. Now they have introduced a new OceanJut score - a unique method of measuring where land most dramatically rises from the ocean around the world.

The OceanJut interactive map allows you to see how quickly and dramatically the land rises from the sea all around the globe. In other words the map can help you find the most spectacular mountain-meets-ocean views in the world. The OceanJut rankings work in the same way as PeakJut scores. A location's ranking is determined not just by elevation, but by how steeply it rises from sea-level. 

Exploring the coastlines which I'm most familiar with, in southern England, I can attest that OceanJut works well in identifying the Seven Sisters & the Isle of Wight's Undercliff as locations where the land rises dramatically from the sea (relative to the rest of southern England). Conversely the lack of any significant OceanJut scores in Essex, Suffolk and Norfolk is one reason why these English counties are so worried about rising sea-levels.

I don't know which locations around the world have the highest OceanJut scores. Fjords obviously score very highly on the OceanJut algorithm. For example Milford Sound in New Zealand scores an impressive 1317m on the OceanJut rankings. Lots of the Norwegian coastline of Norway also scores very highly on the OceanJut scale, largely thanks to its many fjords. 

Friday, June 07, 2024

Every Ship Sunk in WWII

animated world map showing the number of Allied and Axis ship sunk in each year of the war

Over the course of the Second World War more than 20,000 ships were sunk around the world. Esri's Paul Heersink has spent the last ten years scouring historical records to create and map the 'most comprehensive dataset' of ships sunk in WWII.

Resurfacing the Past is a fascinating story map which not only visualizes where Allied and Axis ships were lost in WWII, it also explores the WWII sunken data by year, by size and by type. For example the animated GIF above shows the number of Allied and Axis ships sunken in each year of the war. It clearly shows how the Allies "suffered devastating losses in the first years of the war." However by 1943 it was the Axis who were losing the battle for the seas. The map reveals that from March 1943 "the Allied forces sank more ships every month than they lost."

Mapping the sinks sunk in WWII by type reveals that most of the ships that were sunk in the war were not designed to be combat ships. Non-combat ships such as tankers, tugs, cargo ships and floating hospitals suffered the most losses.

The Resurfacing the Past story map guides you through the huge scope of Paul Heersink's sunken ship data, highlighting some of the important stories that the data reveals. You can also explore the data for yourself on the Esri dashboard map Sunken Ships of the Second World War. This dashboard allows you to map the sunken ships of WWII by country, by year, by the 'country that did the sinking' and by belligerent (Axis, Allies or Neutrals). 

Tuesday, April 23, 2024

Mapping a Global Coral Bleaching Event

an animated GIF of ABC News' globe of global coral bleaching

Last week the National Oceanic and Atmospheric Administration (NOAA) reported that the 'world is currently experiencing a global coral bleaching event'. The Earth has experienced 10 consecutive months of global heat records,  and in the last year the average global temperature has exceeded pre-industrial levels by 1.58C. These unprecedented sudden rises in air surface temperatures are having a devastating effect on the world's coral reefs.

When the oceans get too warm, corals expel the algae that live within them. This algae provides the corals with vital nutrients and without this algae the corals turn white or pale and are much more susceptible to disease and death.

Australia's ABC News has mapped out the extent of coral bleaching in coral reefs around the world. A 3D globe in The Great Ocean White-Out visualizes the current level of risk to coral reefs. The map uses the reef bleaching alert scale to show the level of risk to individual coral reefs.  The map shows that coral bleaching is now a global problem and, according to ABC News, "For the first time ever, coral (is) bleaching on both the Atlantic and the Pacific side of Panama at the exact same time".

In NOAA's announcement of a Global Coral Bleaching Event the agency reports that this is the second global bleaching event in just the last ten years. NOAA suggests that this "global event requires global action". Which is in itself extremely worrying as the world's governments seem unwilling to even meet the voluntary emissions targets that they set themselves in the 2015 Paris Agreement on climate change.


Friday, April 12, 2024

The 2024 Submarine Cable Map

the 2024 submarine cable map presented as a globe

Every year the telecommunications company Telegeography releases a new, updated version of its Submarine Cable map. This map shows all the undersea telecommunication cables which carry data around the world.The 2024 Submarine Cable Map is now available. 

Subsea cables carry telecommunication signals under the oceans, communicating information between different countries and regions of the world. In the 19th Century the first submarine cables were laid to carry telegraphy traffic. In the 21st Century submarine cables carry digital data. This includes all our telephone and Internet data.

This year's version of Telegeography's undersea cable map plots 529 cable systems and 1,444 landing stations. The 2024 Submarine Cable map is available as a free download or you can purchase a wall map for $250. In previous years Telegeography has often experimented with different vintage map styles. This year's edition is much more straightforward (which is probably the most sensible design choice). 

One interesting cartographic choice in this year's edition of the map is the positioning of some of the inset maps on top of the massive Russian landmass. These inset maps provide a close-up view of country landing stations and the cable systems which they serve around the world. Normally you might expect inset maps to be positioned in the ocean, and in the corners of a map. However because the major focus of a submarine cable map is the oceans and coastlines it makes sense to position inset maps inland (although the central prominence of the Egypt hub makes little geographical sense and may owe more to the fact that the map is sponsored by Telecom Egypt). 

You can explore Telegeography's Submarine Cable Maps for previous years just by changing the year in the map's URL. For example, one of my favorite Telegeography maps can be found at http://submarine-cable-map-2015.telegeography.com/. This 2015 map was inspired by medieval and renaissance cartography and features a vintage map style containing sea monsters, cartouches and border illustrations.

Thursday, March 21, 2024

The Sea Trade Monitor

map of the world showing maritime trade routes and recent disruptions caused to maritime trade

PortWatch is a new platform which monitors disruptions to global maritime trade. The platform uses real-time data on ship traffic and maritime trade to provide an alert system on trade disruptions likely to impact shipping trade routes. 

Recent attacks by Houthi rebels on ships traversing the Red Sea have helped to highlight how marine trade is vulnerable to geopolitical instability.. These attacks have forced many shipping companies to reroute vessels around the southern tip of Africa, adding significant time and expense to maritime trade. 

Disruptions to international sea trade can have major economic consequences. In March 2021, when the container ship the Ever Given got stuck in the Suez canal, one of the world's most crucial waterways was blocked for several days. The blockage impacted the movement of a wide range of goods, from consumer products to essential supplies like oil, and it was estimated to have cost billions of dollars per day in lost trade. 

screenshot of the PortWatch Spillover Simulator

The possible global impact of disruptions to maritime trade is why the International Maritime Fund and Oxford University have partnered to release their new PortWatch maritime trade platform. The platform includes an interactive map of Recent Maritime Trade Disruptions. This map plots incidents which have caused disruptions to maritime trade and the ports which have been affected by these disruptions. 

The disruptions mapped by PortWatch include geopolitical conflicts (such as the disruptions caused to trade in the Red Sea by the Houthi rebels) and disruptions caused by severe weather events (such as the ongoing disruption to traffic through the Panama canal due to severe drought conditions).

The Portwatch platform also includes an interactive Spillover Simulator, which allows anyone to simulate a disruption to a particular maritime port and view the likely effect of the disruption on economies around the world. The simulator models the effects of specific port disruptions on the global maritime transport network, on the port's trading partners, and on the supply chain network.

If you want to monitor real-time ship traffic (which can be very useful in visualizing the real-time effects of specific disruption events to maritime trade) then you can use the interactive maps provided by MarineTraffic and VesselFinder.

Saturday, February 03, 2024

Using AI to Detect Oil Spills

SkyTruth's Cerulean is a global monitoring system which uses AI to detect oil slick pollution in satellite imagery. It also identifies nearby vessels which might have been responsible for the pollution. The Cerulean interactive map identifies the locations of possible oil slicks that might go unnoticed by traditional methods, hopefully leading to faster response and cleanup efforts.

Cerulean uses a machine learning model which has been trained on a massive dataset of satellite images in order to identify potential oil slicks. This model continuously learns and improves its accuracy over time. However Cerulean doesn't just stop once a potential oil slick has been detected. It then analyzes AIS data to identify vessels that were in the vicinity of the slick when it was detected. 

Cerulean joins a growing arsenal of tools developed by SkyTruth in order to help protect marine environments. For example Global Fishing Watch (founded by Oceana, SkyTruth and Google) uses AIS data and satellite imagery to track the activities of fishing vessels across the world in real-time. Authorities around the world can use the Global Fishing Watch map in order to detect illegal fishing and to cross-check information reported by vessel operators.

SkyTruth's Flaring Map visualizes daily infrared detections of oil wells around the world burning off excess gas. The SkyTruth Flaring Map uses data detected by NOAA’s Suomi NPP satellite. The map is updated daily to show all infrared detections hot enough to be gas flares. The map then animates through these nightly detections of global flaring.

Hat-tip: Webcurios

Friday, January 12, 2024

Reconstructing the Ancient Trade Routes

Voyage with a Tail Wind: Chronicles of Ancient Maritime Journeys uses an ancient 15th Century book to reconstruct the trade routes used by Chinese spice traders during the Ming Dynasty. The Voyage with a Tail Wind or Shun Feng Xiang Song is a Chinese manuscript, dating from around 1403, which documents the maritime routes, coastal landmarks, and navigational hazards encountered by Chinese sailors navigating the western seas and Indian Ocean.

This story-map animates a journey from China to Indonesia based on the accounts of the sailors retold in Voyage with a Tail Wind. The book records the names of islands visited (or passed) by Chinese sailors on their voyages. This story-map recreates one of these journeys, the 38 day voyage from Wu Yu (modern day Wuyu Island) To Kupang (in modern day Indonesia).

As you scroll through Voyage with a Tail Wind you can follow the journey of a Chinese trade ship as it sails to Indonesia. As you scroll the ship moves on the map while an information window provides a continually updated record of the number of miles traveled. At the bottom of the map a heads up display keeps track of the ship's speed, miles traveled and the amount of time spent on the journey.

As you journey towards Indonesia scrolling info windows use data from the 'Voyage with a Tail Wind' book to provide information on the sights and visual aides used by the sailors to successfully navigate as they journey towards their destination of Kupang.

Saturday, December 02, 2023

Sea Level Rise Maps

Darren Wiens' new Sea Level Rise Simulation map shows how rising sea levels might effect coastlines around the world. Using the simulator you can adjust the height of the sea around the world to see what level of global heating will turn your town into the next Atlantis.

Darren's map uses AWS Terrain Tiles with Mapbox GL's raster-value expression to visualize global sea levels. In very simple terms the map layer turns blue based on the elevation level that the user selects using the sea level slide control. In other words the Sea Level Rise Simulation is only a very rough guide as to how different sea level rises might affect your local environment.

One indication that the Sea Level Rise Simulation map is not intended to be used as an authoritative guide to rising sea-levels is the sea level rise control used on the map. The control only allows you to adjust the sea level visualized on the map in 1 meter increments. 

According to the U.S. Global Change Research Program sea levels have risen by just over 8 inches since 1850. Global heating is however accelerating the rate by which sea levels are rising. According to NOAA the U.S. coastline is predicted to rise by "10 - 12 inches (0.25 - 0.30 meters) in the next 30 years". Unfortunately using the Sea Level Rise Simulation map it isn't possible to adjust sea levels in steps smaller than one meter (so the map can't show you the result of a 10 inch rise in sea levels).

Climate Risk's Coastal Risk Map also allows you to view your risk from projected sea level rise and coastal flooding by year, water level, and by elevation.Share your location with the Coastal Risk Map and you can view the potential flood risk for different years and for different levels of predicted sea level rise. 

The Coastal Risk Map includes a warning that the map may include errors and should only be used as a tool "to identify places that may require deeper investigation of risk".

Coastline Paradox uses Google Maps Street View imagery to visualize how rising sea levels are likely to affect locations around the world over the next three hundred years. The map was created by Finnish artists Pekka Niittyvirta and Timo Aho to provide a powerful visualization of likely sea level rises and their effects on global migration.

Using Coastline Paradox it is possible to view the likely effects of rising sea levels at locations around the world for any year between now and 2300. Select one of the global locations marked on the map with a blue dot and a panoramic Street View image will appear. Superimposed on top of this image is a glowing white line which shows the likely future sea level at that location. You can adjust the date for the sea level prediction at any location by using the timeline control above the map.

Tuesday, November 14, 2023

Ten Years of Global Marine Traffic

The Global Marine Traffic Density Service (GMTDS) map visualizes global marine traffic over the last ten years. The map is designed to support a number of uses, including monitoring fishing activity, monitoring port activity, and environmental and economic activity monitoring.

The GMTDS Map has processed hundreds of billions of AIS signals from over ten years of marine traffic around the world to create this global map of marine traffic density. Using the map you can access and explore over ten years of marine traffic around the world.

Marine traffic density is shown on the map as hours per square kilometer, revealing how many hours in total ships have spent in each square kilometer. You can use the map's time slider to filter the data by month and use the playback controls to animate global marine traffic over time.

You can filter the type of marine traffic shown on the map using the map sidebar. These filter controls include options to select the 'ship type' shown on the map. The ship type option includes cargo vessels, fishing vessels, tankers and even ice breakers.You can also filter the map by draft, which records how far below the water line a vessel's hull normally sits. This is an important consideration for marine navigation, for example for vessels traversing through ship canals and locks. The 'loitering' filter allows you to view where vessels have spent more than six hours in a single cell (square kilometer). 

Also See

MarineTraffic - uses AIS data to create a live real-time map of global ship traffic

VesselFinder - another real-time map of global shipping traffic

Saturday, March 18, 2023

The Climatological Map of the World's Oceans

The European Union's research project 'Climatological Database for the World's Oceans, 1750-1850' extracted weather data from over 280,000 sailing ship logbooks written between 1750 and 1850. The resulting database, containing comprehensive weather observations and voyage details, is an invaluable resource for the study of climate and maritime history.

The Library of Congress has used the resulting database to create an interactive map. The Climatological Database for the World's Oceans, 1750-1850 allows you to explore the logbook information of Spanish, Dutch, French and English sailing ships as they navigated the globe in the 18th and 19th Centuries. If you zoom in on the map you can view the tracks of individual voyages on the map from the trail of individual marked entries over time. Click on a marker on the map and you can view the name of the plotted sailing ship, the date of the log entry and read any entry record related to the day's climate.

The ship markers on the map can be filtered by country. This means that you can get a good overview of where in the world France, Spain, the Netherlands and Britain were trading and colonizing during the period 1750-1850. For example if you filter the map to show only the entries from French and Spanish ships you can see that sailing ships from these countries made relatively few trips to the Indian Ocean. On the other hand many British and Dutch ships in this period were making journeys through the Indian Ocean to India and the East Indies. 
There are more filter controls on the Wooden Ships interactive map, which also allows you to explore European maritime activity from 1750 to 1850. Like the Library of Congress map Wooden Ships is based on the digitized shipping logs from the Climatological Database for the World's Oceans 1750-1850. 

On this map you can also filter the ship positions shown on the map by country of origin. In addition you can use the time-line at the bottom of the map to filter the map by any range of years from 1750 to 1850. This map also allows you to filter the data by wind speed patterns and by other weather and climatic conditions. If you click on a hexbin on the map you can also read entries from the ship logbooks yourself.

Monday, March 13, 2023

The 2023 Submarine Cable Globe

Every year the telecommunications company Telegeography releases a new, updated version of its Submarine Cable map. This map shows all the undersea telecommunication cables which carry data around the world.The 2023 Submarine Cable Map is now available. 

Subsea cables carry telecommunication signals under the oceans, communicating information between different countries and regions of the world. In the 19th Century the first submarine cables were laid to carry telegraphy traffic. In the 21st Century submarine cables carry digital data. This includes all our telephone and Internet data.

This year's version of Telegeography's map plots 529 cable systems and 1,444 landing stations. The 2023 Submarine Cable map is available as a free download or you can purchase a wall map for $250. The landing site for the 2023 Submarine Cable Map features two interactive versions of the map. One of these is a Cesium powered 3D globe of the map. The other is a Mapbox story map which takes you on a guided tour of this edition's many inset maps. 

The 2023 version of the Submarine Cable Map includes a number of these inset maps which provide a close-up view of country landing stations and the cable systems which they serve around the world. The map also features a couple of Olaus Magnus inspired sea monsters and depictions of some of the cable laying and cable maintenance ships which service the global telecommunications network of undersea cables.

Each year's edition of the Telegeography Submarine Cable Map has a different design. You can explore Telegeography's Submarine Cable Maps for previous years just by changing the year in the map's URL. For example, one of my favorite Telegeography maps can be found at http://submarine-cable-map-2015.telegeography.com/. This 2015 map was inspired by medieval and renaissance cartography and features a vintage map style containing sea monsters, cartouches and border illustrations.

Monday, March 06, 2023

Sea Ice in Antarctica

A new interactive sea ice map has been released which can be used to help plan sea voyages and to aid climate change research in the Antarctic. Nilas -The Southern Ocean Mapping Platform uses historical and near real-time data on sea ice & sea-surface temperatures in Antarctica and also allows you to explore both the latest data and historical data on chlorophyll concentrations (a proxy for phytoplankton production).

The Australian Antarctic Division developed the map to support both their research into Antarctica and their operational activities. The map includes sea ice extent and sea surface temperatures dating back to 1981 and chlorophyll from 1998. The data allows the AAD to use the map to help plan marine-science voyages. The map can help scientists to understand the historical conditions during the planned dates of a voyage and to reveal the best time to visit a location to achieve a mission's objective.

The map itself uses the Leaflet JavaScript mapping library. My guess is that Nilas uses a custom made polar projection map of Antarctica. This custom polar projection could then be displayed using the Proj4Leaflet plugin for map projections not natively supported by Leaflet. Nilas also appears to have used the leaflet-panel-layers plugin to help build the map's menu panels. 

If you are interested in exploring historic climate and weather data at the other end of the Earth then you might also be interested in SOAC's maps of the Arctic. The National Snow and Ice Data Center has created a series of interactive maps which visualize Satellite Observations of Arctic Change. The maps allow you to see how sea ice, snow cover and frozen ground have all been shrinking during the 21st Century. Other maps plot air temperature changes in the Arctic and the changes to Arctic vegetation.

Each of the NSIDC interactive maps uses NASA satellite data and research to plot changes to the Arctic from 1979 to 2015. The maps allow you to observe the data for each year in this period to observe how global warming has affected the ecological systems of the Arctic. Global warming is causing observable changes to ecological systems in the Arctic. Air temperatures in the Arctic are rising and sea ice extent is declining. Even Arctic vegetation is changing with tundra being replaced by shrubs.

Friday, February 10, 2023

24 Hours of Ship Traffic in the Bay

Every day hundreds of container ships, high speed ferries, and pleasure boats navigate the San Francisco Bay. The job of orchestrating much of this marine traffic falls to the Coast Guard’s vessel traffic service, based on Yerba Buena Island. You can get a great idea of what this job entails on Mapbox's interactive map Ships in the San Francisco Bay.

Ships in the San Francisco Bay animates 24 hours of marine traffic in the Bay, as recorded by the Coast Guard on September 1st, 2014. On this map you can watch as container ships and other large vessels actually navigate in and out of the Bay and its various shipping ports. The map also includes a guided tour which explains some of the nuances of ship navigation and traffic in the Bay. This tour explains the role of harbor pilots, anchorages for explosives (designated anchorages for oil & gas tankers waiting to unload), and the use of turning basins in the Oakland estuary.

Like San Francisco Bay the North Sea also sees enormous amounts of shipping traffic. Delft University of Technology has mapped the section of North Sea marine traffic which travels past the Netherlands. 

As you scroll through Crowds on the North Sea the map zooms and pans to highlight and explore the different types of shipping traffic active off the coast of the Netherlands. This includes large ferries (used for shipping passengers to and from the Netherlands) and the container ships constantly (sailing in and out of the huge Dutch commercial ports). The AIS tracks of dredging ships can also be seen as they work to keep the main shipping routes open for all other shipping traffic.

The area of the North Sea off the Belgium coast is also one of the busiest seas in the world. In fact Belgian territorial waters are so busy that the North Sea off the Belgian coast sees more marine traffic than both the Panama Canal and the Suez Canal.

To help illustrate the huge amount of marine activity which takes place off the coast of Belgium the financial newspaper De Tijd created an animated map which visualizes 24 hours of marine traffic, using data from marinetraffic. On this animated map different colors are used to show four distinct types of marine vessel. In the story The North Sea is Teeming container ships are shown in yellow, the blue vessels are fishing boats, dredgers are shown in red and other types of ship are shown in gray.