Showing posts with label nature. Show all posts

Monday, June 24, 2024

The Dawn Chorus Map of Birds

map of europe with markers showing the locations of dawn chorus recordings
Each and every morning birds around the world herald the start of a new day by participating in the dawn chorus. While the aural phenomenon of birds singing at dawn is a global one the songs of the dawn chorus can vary greatly depending on where you live and on the make-up of your local avian population. Now, thanks to a new(ish) interactive map, you can tune into this morning serenade at thousands of locations around the globe

Select a marker on the Dawn Chorus map and you can listen to a recording of the morning dawn chorus captured at that location. Dawn Chorus is a citizen science project which aims "to document bird diversity over time using sound recordings through the help of citizen scientists". Using the Dawn Chorus map you can listen to the thousands of dawn chorus recordings already made by these citizen scientists.

The map includes a number of filter controls which allow you to search and listen to the recorded bird songs by location, date, species of bird, and by habitat. If you wish to participate in the project you can record bird song using the Dawn Chorus mobile app, or you can simply upload your own sound recordings directly through the Dawn Chorus website.

Via: weeklyOSM

a map of the world with lots of markers showing the locations of Nature Soundmap sound recordings
From the insect chorus of the Borneo rainforests to the crooning baritone song of an Atlantic humpback whale, the Earth.fm Nature Soundmap can also serenade you with the sounds of nature. Nature Soundmap is a map featuring the sounds of nature captured by professional nature sound recordists around the world. 

Maps have always been a fascinating way to explore the globe. Satellite imagery and Street View imagery have made armchair exploring even more immersive. Add in the sounds of the monsoon in Borneo and the soundscape of the Brazilian rain-forest and you can almost imagine that you really have been transported to the other side of the world.

Monday, December 18, 2023

The Global Birdspotting Map

BirdWeather uses machine learning to detect and map different species of birds around the world. The platform continuously collects sound from active audio stations distributed across the globe and provides what is effectively an automated AI bird spotting map of the world.

Thousands of crowd-sourced audio stations around the world contribute audio data to BirdWeather. Using the BirdNET artificial neural network, a highly sophisticated machine learning algorithm, BirdWeather uses this captured audio data to accurately identify bird calls and songs. From this analysis BirdWeather is then able to automatically map the locations of recorded and identified bird species.

You can explore the results of the machine learning analysis of the audio data provided by thousands of audio stations on the BirdWeather interactive map. This map allows users to explore bird activity by location, species, and by date. Users of the map can also listen to recorded bird calls and songs, and watch live cam streams of selected nesting sites.

If you own a Raspberry PI and a USB Microphone or Sound Card you can also contribute to BirdWeather. Install BirdNET-Pi and you will be able to record and automatically identify bird songs and submit your results to the BirdWeather map.

Active 'twitchers' may also be interested in the eBird interactive map. eBird collects and documents data on bird distribution, abundance, habitat use, and trends. It has detailed information on more than 1,000 bird species around the world. 

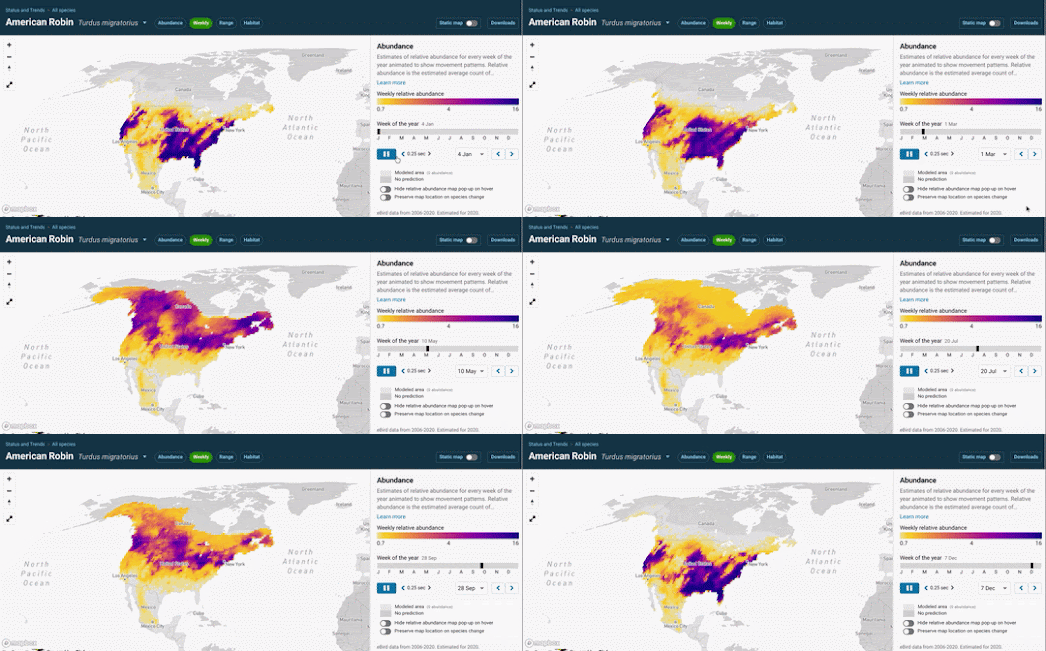
Select a species of bird on the eBird Status and Trends webpage and you can view an interactive map which shows the natural habitat of the selected bird. If you select the 'Weekly' option you can actually watch an animated map showing the species' relative abundance for every week of the year. This allows you to observe the migratory journeys undertaken by the selected species of bird over the course of the year.

Thursday, November 03, 2022

Mapping the World's Flora & Fauna

The popular Pla@ntnet website can help you identify the species of any plant just by submitting a photograph of the plant. Pla@ntnet has now also released a new interactive mapping tool which can list all the different species of plants that can be found in any chosen area.

GeoPl@netNet is a simple tool which allows you to draw an area on an interactive map to discover which species of plants can be seen in that area. You can draw any sized rectangle on the map and GeoPl@netNet will then list all the plant species which can be found there. 

The map uses AI to determine the potential plant species in an area based on climatic variables, soil-types, and data from the Global Biodiversity Information Facility (GBIF). When GeoPl@netNet lists the species which can be found in an area it returns the number of known occurrences of each species recorded by GBIF.

If you are interested in finding out more about the different types of flora and fauna which exist in your neighborhood you can also use the iNaturalist Explore tool. Enter a location into iNaturalist Explore and you can view a list of all the species of animal and plants which have been observed in the area by users of the iNaturalist app.

This app is used by citizen science naturalists around the world to identify and record observations of plants and animals. Using the iNaturalist Explore tool you can discover what observations have been recorded near where you live. You can also search individual species of plant or animal to view a global distribution map of that species' natural habitat. 

Saturday, August 20, 2022

The Migatory Map of the White-Tailed Eagle

Benjamin Becquet has used data from the Global Biodiversity Information Facility to create a mesmerizing animated map visualizing the annual migration patterns of ten different bird species. His Bird Tracking Map uses time-stamped GPS data to reveal the annual migratory journeys of ten different species traveling between Africa and Europe. 

Press the play button on Benjamin's map and you can watch how these different bird species journey back and forth between northern Europe and southern Europe/Africa over the course of a single year. As the map animates through the year the Spring and Autumn migratory patterns of each species of bird becomes apparent on the map.  

The map can be filtered to show only the migratory journey of any single species of bird or any combination from the ten different species. The map also includes a speed button which controls the speed that the time-stamped GPS data is animated on the map. 

If you are interested in the migratory journeys of birds then you might also enjoy eBird's maps of individual bird species migrations. The eBird Status and Trends webpage allows you to view animated maps which show the migratory journeys undertaken every year by thousands of individual species of bird.

Thursday, July 01, 2021

The Animated Map of Bird Migrations

The Bird Migration Map 2018 is an animated visualization of the mass movement of bird migrations across Europe during the whole of 2018. Using the map you can explore the movements of millions of birds over Europe over the course of one whole year.

On the map scaled arrows are used to show the direction and speed of birds migrating across Europe, flying south for the winter and north for the summer. The colored squares on the map show the density of migrating birds. Along the bottom of the map is a timeline which allows you to explore the migratory data by date or to view an animation of Europe's bird migration over the whole of 2018.If you click on a location on the map you can view data on the current values of density and flight speed.

The data for the map comes from the European weather radar network. This network consist of 37 weather radars in France, Germany, the Netherlands and Belgium. The data reveals the flights of migratory birds between 13 February 2018 and 1 January 2019. Using the weather radar data it is possible to collect vertical profiles of bird density, flight speed and flight direction. The 37 weather radars provide point observations so interpolations are made to calculate the movement and density of the bird migrations between the stations.

Thursday, July 02, 2020

Submarine Streetview


During lock-down I've been regularly linking to virtual tours created by museums and art galleries around the world. This week, however, I've decided to take a little break from culture and to spend a little time with nature instead.

For example, this morning I took a little virtual tour of the National Aquarium in Baltimore. The National Aquarium reopened yesterday so you can visit the aquarium for real if you are in the area. However, if you can't get to Baltimore, you can still visit the aquarium virtually on its fantastic customized 'Street View' tour.

Using the National Aquarium virtual tour you can view 360 degree panoramic images of the aquarium and virtually visit the Atlantic Coral Reef, Shark Alley the Amazon River and view all kinds of marine life, including the aquarium's amazing dolphins and sharks.

If you want live views of marine life then you might enjoy the webcams of the Georgia Aquarium and the Monterey Bay Aquarium. The webcams in these two aquariums give you a live view of lots of different marine species, including (but not limited to) beluga whales, sharks, sea lions and turtles.


You can also take a virtual dive beneath the world's oceans on Google Street View. Over the years Google has captured a number of under water Street View images in many different locations around the world. You can explore Google's under water Street View imagery on Google Earth's The World's Ocean collection.

This collection includes Street View imagery from the Great Coral Reef, the Indian Ocean, the Pacific Ocean, the Mediterranean and from many other marine locations around the globe. While exploring these 360 degree panoramic images shot beneath the waves you can virtually swim with all manner of exotic and colorful marine life.


Art Galleries and Museums

If you want some culture with your nature then you can explore many of the world's best museums and galleries during lock-down using their virtual tours. Here are a few more that you might enjoy:

The Metropolitan Museum of Art - includes a number of virtual exhibitions
The National Gallery - London's National Gallery has a number of virtual tours
The Rijksmuseum Masterpieces Up Close - a virtual tour of the museum's Gallery of Honour
The Sistine Chapel Virtual Tour - explore the Sistine Chapel and Michelangelo's astonishing ceiling
The Smithsonian National Museum of Natural Museum - has created a number of virtual tours
The Stonehenge Virtual Tour - places you in the center of this mysterious pre-historic monument
Beijing Palace Museum - the Palace Museum has created a number of virtual tours which allow you to explore some of the museum's galleries and also some of the amazing buildings of the Forbidden City
Buckingham Palace - take a virtual tour around the Queen's favorite pad

Thursday, May 07, 2020

Take a Tree Walk


On leaving my house it takes 567 steps to walk around my block and get back to my front door. I know because I've counted every step. This week alone I've walked around my block at least 30 times. Thanks to coronavirus I am now on very intimate terms with Pond Rd, Church Rd, Baker St and Manor Rd.

Last week, in order to try to enliven my daily exercise routine, I tried Local Sightseeing with Wikipedia. This week I'm learning about all the trees I pass on my daily walk. I am also using TreeTalk to create walks in my neighborhood around all the nearby trees.

TreeTalk is an interactive map of London's trees. It uses data from the Greater London Authority to map trees across the whole of London. It is a great way to learn more about the trees in your local neighborhood. It also includes a great feature which allows you to create a walk centered on any individual nearby tree.

If you click on a tree marked on the map you can learn the tree's common and Latin name. You can also create a walk which starts at your tree and takes you on a tour of a number of other nearby trees. Some of the trees you will encounter on your walk are numbered on the map. Under the map you can learn more about each of the trees shown on your walk, including details such as the color of a tree's bark & leaves and when it fruits or flowers.

Another useful feature of TreeTalk is the 'Visible Trees' option. If you zoom in on your neighborhood on the map and open the Visible Trees tab you can see how many different tree species are in your neighborhood and how many trees there are of each species. You can also select individual tree species to highlight all the trees of that type on the map. This is great, for example, if you want to find all the  edible fruit trees near your home.

TreeTalk only works in London, however lots of towns and cities have interactive maps of local trees. If you search Maps Mania for trees you will find a few tree maps for other cities around the world. If you live in the USA you can also try OpenTreeMap, which has created interactive tree maps for a number of different cities.

Wednesday, April 01, 2020

Meandering Rivers


The Guardian has assembled a collection of beautiful mapped visualizations which use elevation data to reveal some of the normally hidden details in river systems around the world. The maps show elevation values using color intensity to highlight rivers, their tributaries and to reveal their historical paths.

Each of the rivers in the collection includes a slide control which allows you to switch between a satellite view of the river and a view which uses elevation data to reveal features which are normally hidden by vegetation in the satellite view. The maps in Show with the flow: elevation maps reveal world rivers were created by Esri. In each of the maps the darker colors show the areas with the lowest elevations.


Esri's maps remind me of Harold Fisk's meander river maps. In 1944 Harold Fisk published a series of beautiful looking maps of the Mississippi River. In his 'Geological Investigation of the Alluvial Valley of the Lower Mississippi River', commissioned by the Army Corp of Engineers, Fisk not only mapped the flow of the Mississippi but also tried to represent how the river's course has meandered and changed over time.

Fisk's maps use a number of different colors to show the different courses of the river over the centuries. You can view static images of all fifteen of Fisk's maps for the Army Corp of Engineers on this radicalcartography post.

Some of the Army Corp of Engineers' later meander maps of the Mississippi River can also be viewed on Meiotic's Meander Maps. Meiotic has geo-referenced a few of the Army Corp's maps and placed them on top of modern maps and aerial imagery of the river's course. These maps include a slider control which allow you to compare the Army Corp's original maps with a modern map of the river.

Somebits has also geo-referenced all 15 of Fisk's original maps. The 1944 Map Of Former Courses of the Mississippi stitches all 15 maps together. Unfortunately the modern aerial imagery seems to be broken on this interactive map. However you can still compare Fisk's map to a terrain map of the Mississippi and you can use the interactive map controls to zoom-in and study Fisk's beautiful maps in loving detail.

Wednesday, March 25, 2020

Bringing the Outside In


Because of stay-at-home orders many of us are having to forgo the pleasures and joys of the outside world. One solution could be to bring the outdoors inside. For example you can listen to birdsong from home using the fantastic 50 Birds Species and the Songs they Make.

This interactive visualization consists of pictures of 50 common backyard birds. If you click on a bird on the visualization you can listen to a recording of the bird's song. Using the images and the songs is a great way to identify birds that frequent your backyard. Each bird image also includes a little map which shows you the species' normal habitat.


Right now, while stuck indoors in my city home, I'm listening to the sound of the rain falling on the roof of Maweni Farm in Tanzania. Earlier today I was listening to the sound of the dawn chorus in Tempe, Arizona. Later on I might be listening to the natural sounds of the Pacific Forest in Costa Rica.

All this is possible thanks to the wonderful Locustream SoundMap. This map allows you to select and listen to live microphones positioned around the world. Just select one of the microphones on the map and you can listen live to what ever is being recorded right now at that location.

The map includes the Night - Day layer plug-in for the Google Maps API. This means that you can tell at a glance where in the world it is currently night or day. This is very handy if you want to catch the dawn chorus on one of the live microphones, as birds greet the morning sun-rise.


From the insect chorus of the Borneo rainforests to the crooning baritone song of an Atlantic humpback whale, the Nature Soundmap can also serenade you with the sounds of nature. Nature Soundmap is a map featuring the sounds of nature captured by professional nature sound recordists around the world.

Maps have always been a fascinating way to explore the globe. Satellite imagery and Street View imagery have made armchair exploring even more immersive. Add in the sounds of the monsoon in Borneo and the soundscape of the Brazilian rain-forest and you can almost imagine that you really have been transported to the other side of the world.


This map allows you to recreate the soundscapes of different locations around the world by creating your own mix of bird and frog songs which can be found at that location.

The Global Biodiversity Information Facility now includes rich media (sound, images, and video) in their open global biodiversity records. GBIF Soundscape has created a Leaflet map which allows you to reconstruct the 'soundscapes' of particular regions around the world by mixing the various bird and frog sounds that can be heard in those regions.

Select a region from the map and you can listen to a mix of all the bird and frog sounds which have been added to the GBIF data records at that location. At each location you can listen to all the recordings playing at once or listen to a nature sound mix of your own creation. You can also click on the 'random' button to listen to a random mix from that location's sound recordings.

Thursday, February 20, 2020

The Migratory Patterns of Birds


The Cornell Lab of Ornithology is running the largest citizen science project in the world. For fifteen years bird watchers across the globe have been reporting their observations to eBird. The result is a huge database of over 750 million observations, recording dated sightings of thousands of species of birds.

The eBird Science team has used the observations made in North America to create animated migration and seasonal abundance maps for 610 bird species. The maps visualize the abundance of each species across North America and allow you to observe their migratory patterns over the course of each year.

The abundance maps show where each bird species is most common across the continent. These maps use different colors to show the relative abundance of a bird species at different times of the year. The migratory maps allow you to view the migratory patterns of whole populations of bird species across the whole continent of North America. For example in the map above you can observe the abundance of waterfowl in different locations over the course of a year. Note how in the winter the Mississippi River Valley shows up on the map as thousands of waterfowl visit.

Sunday, December 29, 2019

The Butterfly Map


Butterflies is a Leaflet powered map which allows you to explore images of butterflies from the Natural History Museum's digital records. The map shows over 150,000 butterflies which have been organized, classified and mapped using deep learning.

The butterflies have been classified and mapped using the t-SNE machine learning algorithm for visualization. This type of machine learning algorithm maps similar objects closely together and dissimilar objects further apart. Interestingly the taxonomy developed by the algorithm closely matches the biological genus of the butterflies.

If you click on the image of a butterfly on the map then an information window opens showing the original Natural History Museum digital record and its classification and Latin name. You can learn more about how the map was made on Visualizing 150000 Butterflies From the Natural History Museum. This blog post also includes an image of the map with scientific labels showing the genus names of the clustered butterfly families.


The Butterflies map isn't the first time that the Leaflet mapping platform has been used to map small winged insects. British photographer Levon Biss has used the Leaflet mapping library to present close-up photographs of insects. His Microsculpture allows you to view high resolution photos of insect specimens from Oxford University Museum of Natural History in exquisitely fine detail using the Leaflet zooming and panning tools.

Each insect's completed image map consists of around 8,000 individual photographs (the large scale photographic prints are up to 3m high), captured using optical microscopes. The Leaflet mapping library really allows the user to fully explore these high resolution photos by zooming in close on the insects. The map scale in the top right-hand corner of the map provides a useful guide to the size of the insects as you zoom in & out on the images.


And it isn't only insects which can be found on Leaflet maps. Back in 2016 Cornell Lab created a beautiful Wall of Birds interactive map of a photograph of the wall mural in the Cornell Lab's Visitor Center.

Cornell Lab hired artist Jane Kim to paint a huge mural of birds on the largest wall in the Cornell Lab’s Visitor Center. The mural depicts species from all surviving bird families on a map of the world. Each of the 243 birds featured in the mural is painted on the map in a country where that species can be found.

The Leaflet powered map of the mural not only allows you to explore the exquisite detail in Jane Kim's painting it also allows you to learn more about each of the featured species of bird. Click on a bird on the map and a side panel opens with information on the selected species. You can even hear the song of each bird by clicking on the embedded audio recording from the Macaulay Library.

Saturday, June 15, 2019

The Migratory Patterns of Birds


Journey North is a citizen science platform which is monitoring and protecting migratory animal species. Tens of thousands of volunteers across the United States use the platform to report sightings of a number of different migratory animal and bird species. The project has been running for over 25 years and it has accumulated an important and invaluable database tracking the migratory patterns of a number of species. The platform is also used to record the dates when a number of plant species come into bloom.

Each of the animal, bird and plant species tracked on Journey North has its own interactive map. These maps allow you to view the citizen science reported sightings by date and by location. Each map also includes an animation option which allows you to view the sightings animated by month. This animation provides an overview of the migration patterns of each species. For example if you press 'play' on the Barn Swallow map you can observe how the reported sightings of the bird become more northerly from January to July as the swallows migrate north for the summer.


You can learn more about the migratory nature of a number of different American species of birds on National Geographic's Where Do They Go?. For this interactive feature National Geographic has created a series of beautiful maps to visualize the amazing migrations of different bird species in the Western Hemisphere.

Where Do They Go? starts with an impressive animated satellite map showing the fall migration of a Broad-Winged Hawk. This map animates the route of the birds' migration on top of a moving cloud cover satellite map showing some of the strong winds the birds encounter as they travel around the Gulf of Mexico.

As you scroll through Where Do They Go? a map of North, Central and South America is used to visualize the flight paths of different bird species, the major centers of human population and the seasonal changes in vegetation cover across the whole Western Hemisphere. These maps not only help to explain why the birds undertake these migrations but also beautifully visualize the huge distances that they travel.

Tuesday, January 29, 2019

The Amsterdam Tree Map


Amsterdam is one of Europe's greenest cities. There are around 400,000 trees in Amsterdam. Around 75,000 of those trees are elm trees. You can see the location of all those elm trees and Amsterdam's other trees on the city's Tree Map. The City of Amsterdam's Tree Map is an interactive map of the trees maintained by the city authorities. The map shows the location, the height and the species of all Amsterdam's public trees.

The trees shown on the interactive map are color-coded by species. The map also includes a legend which allows you to select to view individual species of trees on the map or a combination of species at the same time. If you zoom in on the map the markers become scaled to reflect the height of individual trees. The map legend also includes the total number of trees and the total number of each species of trees which are maintained by the city.

Also See

The New York City Street Tree Map
Edinburgh Tree Map
London Tree Map
The Trees of Madison
Nine Cities That Love Their Trees National Geographic has mapped the trees in 9 US cities
phillytreemap - Philadelphia's trees

Monday, October 29, 2018

The Map of Ancient Trees


The Woodland Trust has released an interactive map which shows the locations of the UK's oldest trees. The Ancient Tree Index can help you find the UK's oldest trees by location, by tree species and by status.

On the map each tree's marker includes an 'A', 'V' or 'N' to indicate if the tree is of ancient, veteran or notable status. Ancient trees are those that are in the third and final stages of their life. The age of this final stage varies for different species of trees, as some species live longer than others. Oaks, yews and sweet chestnuts can live to over a 1,000 years old. Veteran trees are old trees which haven't quite reached ancient status. Notable trees are usually mature large trees which for some reason stand out in their local environment.

Anyone can add ancient, veteran or notable trees to the Ancient Tree Index. The Woodland Trust has a recording guide which provides instructions on how to measure a tree and how to record different tree forms.

Friday, August 17, 2018

Mapping Raptor Persecution


Birds of prey in the UK all share a common enemy - the human race. Every week the RSPB receive reports of raptors being shot, trapped or poisoned. Many other incidents go unreported. This is why the RSPB has decided to release a centralized hub to monitor and track raptor persecution in the UK.

The Raptor Persecution Hub provides an overview of the illegal treatment of birds of prey in the UK. The hub consists of an interactive map of historical data on raptor persecution going back to 2012. An interactive map visualizes the attacks geographically. The map can be filtered to show the incidents of raptor persecution by date, incident type, county and country.

The Raptor Persecution Hub includes a heat-map view of attacks on birds of prey. If you switch to the heat-map view (using the buttons under the map) you can clearly see where most attacks have been reported. The locations with the most raptor incidents are shown in black and red. This heat-map view shows that upland areas in North Yorkshire, the Scottish borders and Aberdeenshire are hot-spots for attacks on birds of prey. The RSPB believe that this is direct result of the persecution of birds of prey on land managed for grouse shooting.

Saturday, December 09, 2017

Trees of Edinburgh


The Edinburgh Tree Map uses data from a number of sources to map Edinburgh's trees. The map uses colored map markers to show the locations of the city's trees by species.

Using the map menu it is possible to view individual tree species separately on the map or to view all species at once. If you select a tree on the map you can view its Google Maps' Street View image and details about the tree's height and age. Each tree also has its own unique URL (click on a tree to get its link), which means you can share a link to any tree on the map.

The Edinburgh Tree Map was built using Leaflet.js and the Carto Maps API. If you don't want to build your own map and database then you can create a tree map with OpenTreeMap, a paid service which was used to create the Los Angeles and San Francisco tree maps (linked below)

Other Tree Maps:

San Francisco
New York
Los Angeles
London
Melbourne
Madison, Wisconsin

Thursday, May 18, 2017

The Death of Bear 71


For ten years wildlife conservation officers in Banff National Park tagged and monitored Bear71. In the ten years up to her untimely death Bear71 was also often captured by trail cameras in the park. Some of this trail camera footage can be viewed in a new interactive web documentary exploring the life of Bear71.

At the heart of Bear71 VR is a 3D map of Banff National Park. The documentary is narrated from the perspective of Bear71. As the narration plays the map pans and zooms in relation to the content of the narration. If you want you can explore the map for yourself. Just click on the 'story' button at any time to synchronize the map back to Bear71's narration.

The interactive 3D map of Banff National Park also includes a number of interactive points of interest. You can click on these interactions to view webcam captured footage of some of the park's animals. The map also contains links to view traffic webcams and other images of wildlife in the park.

Tuesday, September 27, 2016

The Great Smoky Mountains Species Map


The Great Smoky Mountains National Park is home to over 1,800 different plant and animal species. You can now view where the park's different animals and parks live on a new interactive map of the park.

The Great Smoky Mountains National Park Species Mapper allows anyone to view the distribution of plant and animal life in the park. It provides a tool for park managers to protect life in the park and assess the impact of different species on other life in the the park. It also provides a handy tool for visitors to explore what they might see when they visit the park.

You can use the drop-down menu to select a species to view on the map. You can also select to compare the distribution of the selected species with one or two other plants or animals. Alternatively you can choose to compare your selected species with other species which share a similar distribution in the park.

Thursday, September 15, 2016

Bird Migrations Around the Globe


The Globe of Bird Migration is a mapped visualization of the migratory paths of 11 different species of birds around the world. The simplified migratory paths of each of the 11 bird species are animated on a 3d globe over the course of twelve months.

You can select to view the path of any of the 11 species using the menu on the left of the globe. When you select a species from the list you can view a few details about the birds' estimated population and conservation status. You can also discover where it breeds and winters and how far the species migrates.

Each bird species' migratory path is animated on the 3d globe. The breeding areas of the selected species is shaded on the globe.  The wintering grounds of the species is also shaded on the map. If you press play on the globe timeline you can view the bird migrating back and forth from its breeding and wintering grounds over the course of the year.

The 3d globe was custom coded for the visualization using the Unity WebGL engine and 3DS Max.

Monday, August 15, 2016

Climb the Zugspitze on Street View


You can now climb Germany's highest mountain in a new custom Street View tour from Zugspitze 360°. The tour consists of hundreds of panoramic images which allow you to virtually climb Zugspitze, from the foot of the mountain at Höllental all the way to the summit.

All the custom captured Street View images of the tour have been stitched together using the Google Maps API. This means that if you've ever used Google Maps before then you will easily be able to progress through the tour using Street View's familiar navigation arrows. The tour also includes a handy on-screen menu which allows you to quickly jump to different stages of this mountain tour.

As you progress through the stunning panoramic images of the Zugspitze you can also learn more about the mountain from a number of audio guides dotted along the route (in German).

As well as the amazing custom created Street View tour of the mountain Zugspitze 360° includes lots of useful information for anyone who wants to climb the mountain for real. This includes general information about the route & its highlights and track routes & tips which you can download.

Currently Zugspitze 360° has stage one of three stages which you can explore in Street View. Stages two and three will be released in the next few weeks.