
Donald Trump wants to spend millions of hard working Americans' tax-dollars on a wall between the United States and Mexico. KPBS claims that 653 miles of that wall already exists, 90% of which was built in only the last 12 years by Presidents Bush and Obama.
KPBS submitted a number of Freedom of Information requests to U.S. Customs and Border Protection in order to learn where that 'wall' is and when these sections were built. You can explore the data on their new interactive map
America's Wall.
Using the map you can select sections of the wall to see when it was constructed and what type of physical barrier it is. You can also use the timeline chart to see how much of this existing wall was built in any particular year. This timeline is synced to the map. When you click on the chart the map is filtered to only show the sections built in the selected year.

USA Today flew & drove along the entire 2,000-mile border between the United States and Mexico. During these journeys they mapped every known piece of the existing border fence between the two countries. You can view the locations of this existing border fence and also view the aerial video USA Today shot during their flight along the border on their interactive map.
Should we build a wall? A 2,000-mile search for answers not only maps the existing border fence but also explores some of the problems the USA could face in trying to build Trump's wall between Mexico & the USA. The map shows where the existing fence consists of vehicle barriers, pedestrian fencing, other fencing and where no fencing currently exists.
The beginning of 'Should we build a wall' is in a story map format. This section explores some of the geographical, economical and legal problems the USA could face in trying to build Trump's wall. You can view some of these geographical problems yourself in the USA Today's aerial videos. If you scroll to the bottom of the story map and click on the 'Explore the map' button you can click on the map to view videos of the aerial footage captured during the flight along the border.
'Should we build a wall' is just one part of USA Today's special report
The Wall - an in-depth examination of Donald Trump's border wall. In the rest of the report you can read interviews, listen to podcasts and explore the border in virtual reality.

Reveal, from the Center for Investigative Reporting, has also been collecting data on the US-Mexico border for a number of years. They have spent a long time mapping the existing border fence using satellite imagery and government PDF maps of the border.
From this data Reveal has discovered that around 700 miles of the 1,954 mile-long U.S.-Mexico border is already fenced. Trump's new wall will therefore need to be at least 1,300 miles long. That's a lot of Chinese steel. You can explore Reveal's work on their
The Wall interactive map. The map shows the current fence and shows where it is a 'vehicular' and where it is a 'pedestrian' fence. The map also shows where no fence currently exists.
You can get a good sense of the scale of construction needed to build Trump's new wall in a video from the Intercept. The Intercept downloaded and stitched together 200,000 satellite images to create a huge strip map of the U.S.-Mexican border. You can view this strip map in
Visualizing the U.S.-Mexico Border, a short video which pans along the whole border.
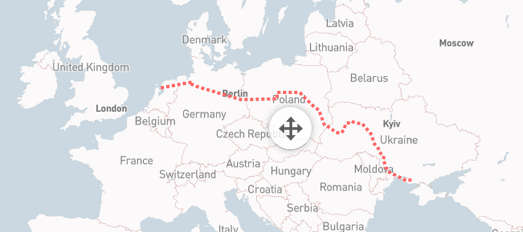
From Donald Trump's 'detailed' construction plans we know that the Trump Wall will be up to 15 meters high, made of concrete and steel (
but also possibly fencing) and will be 1,954 miles long. If you are having difficulty envisioning just how far 1,954 miles is then you can use the Berliner Morgenpost's interactive map. The
Trump Wall Comparison Map allows you to overlay an outline of Trump's proposed border wall between the USA and Mexico on any other location on Earth.
If you want to create your own Trump Wall map then you can get Reveal's
data for the US-Mexico border fence on Github. You can read more about how this data was collected and mapped in the Reveal article
The Wall: Building a continuous US-Mexico barrier would be a tall order.


