Build a Wind Turbine in Your Garden
Visualizing wind turbines in 3D is an interactive map which can help you visualize the visual impact of erecting wind turbines at any location on Earth.
Despite wind energy being a clean and relatively cheap source of energy the construction of new turbines can sometimes meet local resistance. People are often opposed to the erection of new turbines because of the visual impact of turbines on the local landscape. 'Visualizing wind turbines in 3D' allows you to model the visual impact of new wind turbines (of any height) by allowing you to add a 3D model of planned new turbines to a 3D map.
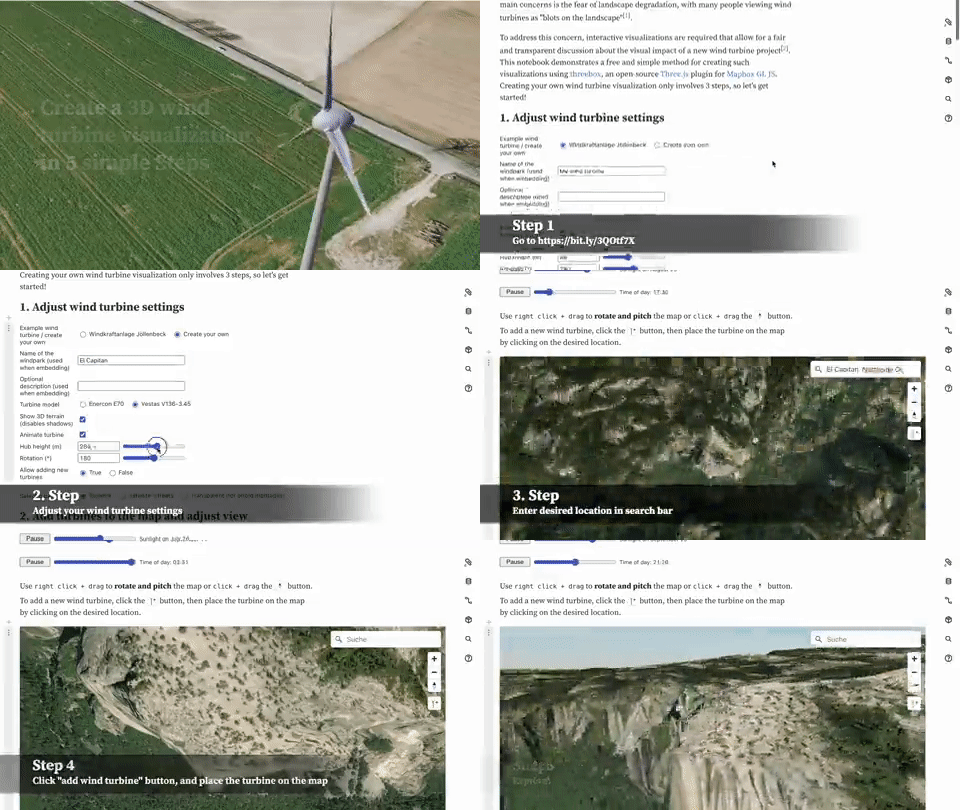
Using the map you can choose between two different types of turbine model (Enercon E70 or Vestas V136-3.45). You can also adjust the height of the wind turbines you want to add to the map. You can then add the 3D model of your wind turbine to any location simply by selecting the add turbine button and clicking on the map.
The map was created using three.js and Mapbox. If you want to experiment with adding your own 3D models to an interactive map then the Add a 3D Model example in the Mapbox GL development docs is a good place to start.


Комментарии