четверг, апреля 30, 2015

Improving the Map of Nepal


The availability of accurate maps is particularly important in times of emergency to help disaster response teams and aid agencies to effectively manage the teams on the ground.

Humanitarian Open Street Map Team (HOT) is a non-profit organization which coordinates the creation and distribution of free mapping resources to support humanitarian relief. Since the devastating earthquake in Nepal HOT has been organizing the response of the Open Street Community to improve the OSM maps of Nepal.

Mapbox has created a map visualizing the improvements to OpenStreetMaps in Nepal following the 2015 earthquake. Nepal Freshness shows the OpenStreetMap roads and features which have been created or updated since the earthquake. The yellow features are the newest updates to the map.

The response of OpenStreetMap contributors has been truly amazing. Over 2,000 different volunteers have been helping improving the map of Nepal, quadrupling the road coverage and adding 30% more buildings to OpenStreetMap in Nepal.


Mapbox has also released a map which is designed to help OSM mappers identify areas of Nepal which are likely to have suffered the most damage. The Nepal Damage Analysis map visualizes approximate impact levels for every building and road in OpenStreetMap.

Building footprints on the map are colored by the interpolated peak ground acceleration at each location. The red buildings are the ones which are likely to have experienced the strongest shocks. The areas with the reddest buildings are the places which have experienced the most ground movement and are therefore likely to have suffered the most damage.

Mapping Photographer's Routes


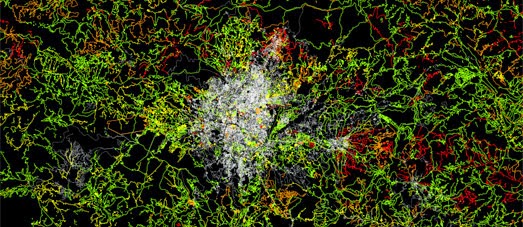
The Geotaggers Atlas is a fascinating map showing the paths taken by Flickr photographers between separate photographs, based on the time stamps and locations of the photos. Using the map you can zoom in on any city in the world and discover not only the most popular places photographed by Flickr users but the paths the photographers have taken around those cities.

For five years Eric Fischer of Mapbox has been extracting the data from Flickr photos and mapping not just where those photos are taken but the routes that the photographers have taken between pictures. Using the Flickr search API Eric is able to retrieve the photo geo-tags and draw lines between all the photos in a sequence.

The red lines on the map show where a photographer traveled at a speed between 7 and 19 mph, based on the time stamps and locations of the pictures. As you can see on the map of Paris above the river Seine is full of red lines, as ferry passengers happily travel down the river snapping the sights of Paris.

The map is a great way to see where people love to take photos in cities around the world. In the example above you can see that the Champs Elysees is a popular route for photographers. The Eiffel Tower (on the left of the screenshot) is also a popular location with photographers.

The Geotaggers Atlas covers every city in the world using over ten years of photo data from Flickr. The map is able to display such a huge amount of data thanks to Tippecanoe. Tippecanoe is a tool for building vector map tile-sets from large collections of GeoJSON features. Input GeoJSON into Tippecanoe and it will give you back a vector mbtiles file. It is a very efficient way to visualize very large data-sets on an interactive map with minimal impact on performance.

среда, апреля 29, 2015

The Canadian Immigrant Map


The Canadian Immigrants Interactive visualizes which immigrant groups are the most populous in different parts of the country. The map uses data from the 2011 National Household Survey to find the most common country of origin in each census division in Canada.

The most common countries of origin for Canadian immigrants are the USA, the UK and France. The map therefore allows you to exclude immigrants from these countries from the map. The Canadian Immigrants Interactive can also be used in conjunction with the 10 and 3's language map of Canada.


You might be surprised to learn that in the far north of Canada, in the Northwest Territories, the most spoken language (after French and English) is Arabic.

The 10 and 3 has mapped the most prevalent languages, besides French and English, spoken in Canadian homes. Using data from the 2011 census the site has mapped the most prevalent non-official languages in each census division.

Canada’s Far-Flung Language Enclaves shows the results of the analysis on a Google Map. The map colors each census division by the most prevalent language. You can mouse-over each division on the map to view the percentage of the population which speaks the most prevalent language (after French & English).

The American Highways Transit Map


Cameron Booth of Transit Maps has created an interactive version of his popular 'subway map' style atlas of American highways.

The Highways Map USA shows every single Interstate Highway and U.S. Highway in the contiguous 48 states. You can buy a print of the map on Cameron's website but this interactive version of the map allows you to pan & drag the map and zoom in on particular junctions.


The map was created using Zoomify to create the map tiles from the static map. Showing Zoomify Images with Leaflet explains how to do this and includes a Leaflet plugin to add the created tiles to a Leaflet map.

Cameron's map also uses a dynamic URL scheme so you can link to individual areas & zoom levels on the map. This functionality can easily be added to Leaflet maps using the Leaflet-hash plugin.

The Walksheds of Boston


Exploring Transit and Driving Behavior in MA examines the effect of Boston's public transit network on the amount of traffic on Boston's streets. The article visualizes a number of data-sets on a series of Google Maps to explore how proximity to MBTA transit corridors impacts on the car driving frequency of Boston residents.

The maps include a simple visualization of the walksheds around each MBTA station (shown above). More revealing is a map of the number of vehicle miles driven by a typical household in Boston.


This map reveals that Boston residents tend to drive more the further they live from the center of the city. It also reveals that the MBTA transit corridors have an effect on the use of cars, as those who live closer to the MBTA tend to drive less vehicle miles than those who live further away.

The map itself would benefit from a little bit of customization using the Google Maps API Styled Maps feature. For example, transit lines on the map could be emphasized by giving them a higher weight and perhaps by giving them a different color.

Exploring Transit and Driving Behavior in MA also includes a map of 'transit effectiveness'. This map evaluates Boston addresses by their access to public transit. The evaluation is based on the frequency of nearby stops, divided by the distance to those stops, and adjusted by a 'quality factor' based on the  mode of transit.

вторник, апреля 28, 2015

The Mapped Guide to Walking in L.A.


It isn't true that no one walks in Los Angeles and, despite all claims to the contrary, there are some great places to walk in the city. To help you find those great walks the Los Angeles Times has created the L.A. Walks Map.

The map features walks which have featured in the newspaper's monthly L.A. Walks series. If you select a marker on the map you can view details on the length, time and difficulty of the walk. If the walk takes your fancy you can then click through to read all about the walk, as featured in the L.A. Walks series.

The full article on each walk includes step-by-step directions for the walk, details about some of the sites you can see along the route and photographs taken on the walk.

The Hyundai Factory Street View Tour


You can take a fully guided tour of the CAOA Hyundai factory in Brazil thanks to a new narrated Street View tour of the factory

Fabrica Hyundaicaoa takes you on a tour of the factory, allowing you to follow the fully automated journey of the cars as they go from the body shop to the paint shop, through trim and finally to the test center. The whole tour is narrated (in Portuguese) and plays automatically, so all you need do is sit back and watch.

If you want you can interrupt the tour at any point and take your own path through the factory by using the arrows on the Google Maps Street View imagery. You can also use the timeline at the bottom of the page to quickly navigate to different parts of the factory.

Hello - Planet Earth


Created for Earth Day 2015 Above the Clouds is billed as a 'real-time interactive cinematic experience celebrating the Earth'. In truth it isn't really real-time (apart from the fact that you actually watch it in real time) and there is very little interactivity.

However Above the Clouds is very cinematic. The site uses a WebGL globe with text from Carl Sagan and music from Sean Beeson to present a tour of this planet we call home. There really isn't much interactivity so you might as well just sit back and enjoy the experience as the 3d globe zooms in on some amazing satellite views of the Earth.

понедельник, апреля 27, 2015

Basketball Shooting Heatmaps


Last week Maps Mania linked to CartoDB's Referee Map, an animated heatmap of one soccer referee's movements during a soccer game. The map uses CartoDB's Torque library to animate the referee's heat map over the ninety minutes of a single match.

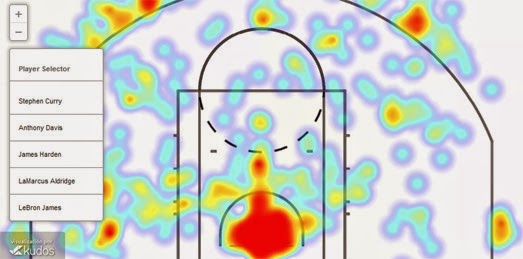
Player heatmaps are obviously very popular in other sports. In the NBA shooting heatmaps can be used to reveal the individual shooting patterns of different players, showing where they are most dangerous on the court. 2014-15 NBA Regular Season : Field Goal Shooting Patterns is a CartoDB map that shows the shooting heatmaps of five players during the 2014-15 season.

Using the map you can view and compare the shooting heatmaps of Stephen Curry, Anthony Davis, James Harden, LaMarcus Aldridge and LeBron James.

Map of the Dead


The cemeteries of Chicago are home to a number of famous & infamous figures from history. The Chicago Tribune's Tour of the Dead is a handy guide to anyone interested in visiting the final resting places of some of the individuals who have helped influence Chicago and the world.

The map includes some of Chicago's infamous gangsters, such as Al Capone and Sam Giancana. From the world of films & entertainment the Tour of the Dead shows the graves of John Belushi, John Hughes and Muddy Waters. The map also includes a number of famous sports stars (such as Jesse Owens) and local & national politicians.

Mapping London & Berlin's Squatting History


The London Squats Archive is a Leaflet map dedicated to archiving evicted squats in London. The project is not a map of current squats, to minimize visibility concerns for currently occupied spaces, but is solely concerned with documenting squats which no longer exist.

If you select a squat's marker on the map you can view details about when the building was squatted, for what purpose and the duration of the squat. However data for a lot of the squats is a little sparse. This is a shame because if the dates for most of the squats were recorded a timeline could be added to the map. This would help to provide an interesting history of squatting in London over the years, similar to the history of Berlin squatting provided by Berlin Besetzt.


Berlin Besetzt is a map showing the locations of squats in Berlin from 1970 to the present day. You can view all the houses that have been squatted in this period or you can use the date slide control to view the history of squatting in Berlin over the last few decades.

Using the date control it appears that 1981 was the golden age for squatters in Berlin. It is also interesting to note the rise of squatting in east Berlin after the fall of the Berlin Wall. The map also reveals that Kreuzberg has remained a very popular area for Berlin squatters for more that thirty years.

воскресенье, апреля 26, 2015

The Maps of the Week


There were two real stand-out maps this week, NASA's 3d map of the Vesta asteroid and Refugee Republic's map of Domiz Refugee Camp.

Domiz Refugee Camp in Iraqi Kurdistan was established in April 2012 to host Syrian Kurds. The camp was originally built to house 38,135 people. It is currently home to 57,953 refugees. As the number of refugees has grown the camp has gradually transformed from a temporary refuge into a makeshift town,

Refugee Republic has created an online documentary about the camp, using the Leaflet.js mapping platform to turn a hand drawn map into a fully interactive map. You can click on the colored roads and arrows on the map to learn more about life in Domiz Camp. The tour includes videos of the camp, information on how the camp and shelters were constructed and the stories of some of the refugees now living in Domiz Camp.


In 2011 the DAWN spacecraft visited Vesta to collect data about this important asteroid. You can now explore Vesta yourself using NASA's Digital Model of Asteroid Vesta.

Vesta is one of the largest asteroids in the asteroid belt, with a mean diameter of 525 kilometres. The Digital Model of Asteroid Vesta allows you to view the asteroid as a 2d or 3d map. The map itself seems to combine an Esri map with a Cesium WebGL globe.

The 3d map includes a number of data overlays which provide different views of the mineral make-up of Vesta. The 2d map view includes a global (equirectangular) view of Vesta, a north pole view and a south pole view. It also includes a number of tools which allow you to measure distance on Vesta and to view elevation profiles (especially handy if you want to visualize the depth of Vesta's craters).


One of the joys of maps is that they allow you to explore places that you might never visit in real-life. Having already explored an asteroid and a refugee camp why not also take a tour of Robben Island. Google has released Street View imagery for Robben Island in South Africa.

Robben Island is most famous as the prison where Nelson Mandela was held for 18 of the 27 years he served behind bars. The best way to explore the new Street View imagery is on the Robben Island Museum page on Google's Cultural Institute website. The Robben Island Museum entry includes a guided tour of the prison by former political prisoners. The Robben Island Prison Tour is a guided tour of the prison using the new Google Maps Street View imagery and narration from former political prisoner, Vusumsi Mcongo.

The tour includes the view prisoners would have on arriving at the island, a view from inside a guard tower, the hospital ward, the exercise yard and Nelson Mandela's own 2m x 2m cell. Most of these Street View scenes are accompanied by videos in which Vusumsi Mcongo explains what life was like as a prisoner on Robben Island.

суббота, апреля 25, 2015

Why Your Street Has That Name


Back in 2013 Noah Veltman released a History of San Francisco Place Names. This map started a trend in etymology mapping. Now interactive maps are springing up all over the world whose only purpose is to explain the origin of city place & street names.

Famostrato - Personajes históricos de las calles de Madrid is a new Spanish map which explains the origins of street names in the Spanish capital which have been named after important or famous individuals.

If you click on one of the colored streets on the map of Madrid an information window opens providing a link to the Spanish Wikipedia article of the person whom the selected street was named for.


The History of San Francisco Place Names was the original place name etymological map. The History of San Francisco Place Names is a fascinating insight into the history of the names behind the California city's landmarks and streets.

Click on any of the streets or landmarks, marked in blue on the map, and you can find out who it was named after or where the name originally came from.


Democracy Street is a UK map, partly sponsored by the UK parliament, which is attempting to map the influence of democratic history on the country's place-names. Using the map you can discover which streets in your neighborhood have been named after a politician or someone else who has been important in some way to the country's democratic history.

Streets and roads named after an individual important to UK democracy are shown on the map in yellow. These streets are further highlighted on the map by a larger white circle lighting up the underlying Stamen toner map tiles. If you select a yellow marked road on the map you can learn a little more about the person whom the road was named after.


Straßenkrieg is a fascinating map revealing the history behind the many Berlin street names which have a military connection. The map highlights Berlin streets which have been named after battles, important military leaders or German army regiments.

All the military connected roads are highlighted on the map with colored lines. The colors indicate the historical period associated with the road's name, e.g. Prussian, the Weimar Republic, National Socialism or post-WWII. If you select a road on the map you can read a brief explanation of the military relevance of the road's name and click-through to read a more detailed account of the person or battle memorialized.

пятница, апреля 24, 2015

Mapping Life in a Refugee Camp


Domiz Refugee Camp in Iraqi Kurdistan was established in April 2012 to host Syrian Kurds. The camp was originally built to house 38,135 people. It is currently home to 57,953 refugees. As the number of refugees has grown the camp has gradually transformed from a temporary refuge into a makeshift town,

Refugee Republic has created an online documentary about the camp, using the Leaflet.js mapping platform to turn a hand drawn map into a fully interactive map. You can click on the colored roads and arrows on the map to learn more about life in Domiz Camp. The tour includes videos of the camp, information on how the camp and shelters were constructed and the stories of some of the refugees now living in Domiz Camp.

Mapping Washington's Life


I've been obsessing lately about Creating Stories with Historical Maps. One website which does this very well is Washington's World.

Washington's World is a biographical map of George Washington's life, from his birth in Westmoreland County, Virginia to his death at Mount Vernon. The map includes the option to display various journeys undertaken by Washington during his life, including, his presidential tours and his trip to Barbados.

Washington's World has recently added a number of historical map layers to the map. These historic maps allow you to explore some of the locations highlighted on the map as they looked during Washington's own life.

Android Pisses All Over Apple


Google Maps has plotted out a new park in Pakistan which looks incredibly like the Android logo pissing on the Apple logo. Check-out it out now because I have a feeling this park will soon be gone from Google Maps.

Google's Map Maker program allows anyone to make corrections to Google Maps. Any changes made using Google Map Maker need to be reviewed before they actually get added to the data on Google Maps. The pissing Android logo was created by Google Map Maker contributor 'nitricboy'.


My guess is that nitricboy will be now losing their permission to add changes to Google Maps. However I don't think that they will be too upset judging by this other little edit that they have made to Google Maps in Pakistan (pictured above).


This isn't the first time that pranksters have managed to circumvent the Google Map Maker's review process. In July of last year a user managed to add a Tardis and a Cyberman to Google Maps in Wales (sadly both the Tardis & Cyberman were quickly removed by the spoilsports at Google).

Late last year someone also managed to add a picture of a cat to Google Maps in Auckland, New Zealand.

Animated Football Heat Maps


Over the last couple of years player heatmaps have become a very popular data visualization method for showing the influence of individual soccer players over the course of the ninety minutes of a soccer game. These static heatmaps tend to be used to show the areas of the pitch where an individual player has been most active during a soccer match.

This CartoDB Referee Map shows an animated heatmap of one soccer referee's movements during a soccer game. The map uses CartoDB's Torque library to animate the referee's heat map over the ninety minutes of the match. If you adjust the timeline to the beginning of the game you can see the full GPS track of the referee over the ninety minutes without the heatmap layer.

The map provides a neat demonstration of how CartoDB's Torque library could be used to animate an individual soccer player's movements during one game. Unfortunately it might be difficult to get hold of the data for a player's movements during a professional match. European soccer leagues tend to have contracts with sports data companies (such as Opta) who then charge exorbitant rates to use the data from professional soccer games.

четверг, апреля 23, 2015

The Canadian First Nations Map


Native-land.ca is a Google Map of First Nation territories, languages and treaties in Canada. It also provides an extensive 'resources' page linking to many other websites about First Nation territories and languages.

Using the map layer buttons it is possible to view any combination of the three layers on the map. The 'Nations' layer provides a guide to the territories occupied by the different First Nation nations, clans and tribes in Canada. The 'Languages' layer provides an overview of where the different First Nation languages were spoken.


Pan Inuit Trails is a Google Map of Inuit trails and place-names in the Canadian Arctic, including Inuit waters, coasts and lands based on written historical records.

The Inuit trails shown on the map include boat routes, walking trails and sled trails which connected the Inuit people with resources and with other Inuit. The Inuit place-names and trails are based on written records and maps from the 19th and 20th centuries.

You can search the map by clicking on the trails or places displayed on the map or by searching by keyword. You can also turn on the 'Maps' layer which reveals the bounding boxes of the original historical maps. If you select a map bounding box outline you can view the original map in the sidebar.

Creating Stories from Historical Maps


The NYPL Map Library and the David Rumsey Historical Map Collection provide a great resource for any developers who wish to use historical map layers in their online maps. Last month I created a story map using a historical map and images from the NYPL Digital Collections.

My Gangs of New York story map recounts the famous battle between members of the Dead Rabbits gang and the Bowery Boys in the Five Points district of Lower Manhattan in the mid-Nineteenth Century. The map was created using Leaflet.js, waypoints.js and a historical map and images from the NYPL.

If you want to create your own story map using a vintage map layer then it is probably easier to use one of the existing story map templates, such as Esri's Story Maps or CartoDB's Odyssey.js. Combine either of these story map templates with vintage map layers from the NYPL or David Rumsey and you have a powerful tool to explore and explain historical events.

Stacey Maples has provided a very interesting tutorial, Cartodb/Odyssey.js Tutorial for Making Story Maps, which provides a step-by-step guide explaining how you can create a story map using Odyssey.js with an historical map layer from the David Rumsey Historical Map Collection.

The tutorial takes you through how Stacey created a history map exploring the modern history of tattooing in San Francisco. Before following the tutorial have a look at the finished Tattoo Map of San Francisco.

If Stacey's tutorial inspires you to make your own historical story map then you might want to check out Vintage Maps of San Francisco, which is a little collection of some of the georectified historical map layers of San Francisco available in the David Rumsey collection. The NYC Time Machine provides a similar collection of georectified vintage maps of New York, from the NYPL Map Warper project & the David Rumsey Historical Map Collection.

Choropleth Transitions in Leaflet

Fancy effects for your map applications with CSS is a series of CSS tricks which you can apply to Leaflet maps. Most of the CSS effects in the series are applied to the map when the user pans or zooms the map and (in my opinion) don't really add much to the user experience.

However I do really like the first example, which uses Fill Color Transitions, to create a nice transition effect between two different choropleth layers.

See the Pen emqoOX by moklick (@moklick) on CodePen.

As you can see in the embedded map above the CSS fill transition creates a nice fading effect to the choropleth polygons when the user switches from one choropleth layer to another. It is a rather nice looking effect and well worth the effort of adding only one line to your style sheet.

среда, апреля 22, 2015

Mapping Australian Marine Life


Red Maps' Spot.Log.Map is an Australian citizen science project set-up to record uncommon marine species around the Australian coast. By asking members of the public to submit uncommon marine life in the seas around Australia the project hopes to see which marine species may be extending their range in response to changes in the environment, such as ocean warming.

The site includes a Google Map on the project's home page, which animates through photos of the latest sightings reported to Spot.Log.Map. If you click on the 'sightings' tab you can also view a map of all the uncommon sightings logged by Spot.Log.Map contributors. The map includes the option to filter the sightings displayed on the map by marine species.

If you register with Red Map or sign-in with a Facebook account you can contribute to this citizen science project by mapping your own sightings of uncommon marine species.

Robben Island Street View


Google has released Street View imagery for Robben Island in South Africa. Robben Island is most famous as the prison where Nelson Mandela was held for 18 of the 27 years he served behind bars.

The best way to explore the new Street View imagery is on the Robben Island Museum page on Google's Cultural Institute website. The Robben Island Museum entry includes a guided tour of the prison by former political prisoners. The Robben Island Prison Tour is a guided tour of the prison using the new Google Maps Street View imagery and narration from former political prisoner Vusumsi Mcongo.

The tour includes the view prisoners would have on arriving at the island, a view from inside a guard tower, the hospital ward, the exercise yard and Nelson Mandela's own 2m x 2m cell. Most of these Street View scenes are accompanied by videos in which Vusumsi Mcongo explains what life was like as a prisoner on Robben Island.

The Football Fandom Map


Last year the New York Times had a lot of success with a series of maps visualizing sports fans based on Facebook 'likes'. First it released a Map of the Baseball Nation. It followed this by Mapping the Basketball Nation. Then it got around to football with the College Football Fan Map.

Where Facebook has 'likes' Twitter has followers. So Twitter has decided to create its own sports fan map of football teams in the UK's Premier League. The map shows the geographical spread of followers of each of the official Twitter accounts for each Premier League team. Using the Premier League Follower Map it is possible to select each of the individual Premier League teams and view where their Twitter followers are based around the world.

Also See

The UK Austerity Map


The current UK government has pursued five years of austerity measures as it tries to get the country's deficit under control. One of these measures has been to drastically cut welfare payments.

The Financial Times has used data compiled by the Centre for Regional Economic and Social Research at Sheffield Hallam University, measuring the impact of government welfare cuts on individual local authorities, and created an Austerity Audit Map of England, Scotland & Wales.

The map provides a choropleth view of the impact of the welfare cuts on each local authority. If you select an area on the map you can view the annual impact on each working adult in the region. This is shown by the average number of pounds taken out of the local economy per working adult.


While looking at the FT's Austerity Map it occurred to me that the least affected areas looked suspiciously like a map of the ruling Conservative party's current constituencies.  Bet2015 has a nice map showing the current seats of the political parties in the UK, so it is easy to make a comparison between the two maps.

Is seems obvious when looking at the two maps placed side-by-side that the present government in the UK has implemented austerity measures that have (perhaps coincidentally) had far less economic impact on supporters of their own voters.

вторник, апреля 21, 2015

Asteroid Mapping


In 2011 the DAWN spacecraft visited Vesta to collect data about this important asteroid. You can now explore Vesta yourself using NASA's Digital Model of Asteroid Vesta.

Vesta is one of the largest asteroids in the asteroid belt, with a mean diameter of 525 kilometres. The Digital Model of Asteroid Vesta allows you to view the asteroid as a 2d or 3d map. The map itself seems to combine a Esri map with a Cesium WebGL globe.


The 3d map includes a number of data overlays which provide different views of the mineral make-up of Vesta. The 2d map view includes a global (equirectangular) view of Vesta, a north pole view and a south pole view. It also includes a number of tools which allow you to measure distance on Vesta and to view elevation profiles (especially handy if you want to visualize the depth of Vesta's craters).

It is also worth noting that the map's labels are also interactive. If you click on a map label you can learn more about the labelled feature and the name's etymology.

Tornadoes - Before & After Imagery


Disaster Response Maps has put together before and after aerial imagery of areas affected by the April 9th tornado in Illinois. Before and After the 2015 Tornadoes in Illinois uses the Esri Story Maps swipe tool to allow you to compare the two sets of imagery side-by-side.

Back in 2011 I created something similar after the tornadoes in Alabama. 2011 Tornado Damage - Before and After uses aerial imagery from the NOAA and from Google Maps to compare before and after imagery of a number of areas hit by the April 2011 tornadoes in Alabama.


Over the years the New York Times has created a couple of interactives which allow you to inspect tornado damage from ground level. In Panoramas of Joplin Before and After the Tornado the Times used Google Map Street Views of Joplin side by side with panoramas taken after the 2011 Joplin tornado hit.

In 2013 the Times repeated the exercise after a tornado hit Moore, Oklahoma. Before and After: 360° Views From Moore. The custom Street Views in the interactive are synced with the Google Maps Street Views. If you pan either Street View both the before & after image moves, enabling you to easily compare the images around the whole 360 degrees.

Where the River Flows


This Spanish map provides information on peak flood flows for all major Spanish rivers. Mapa De Caudales Maximos (Maximum Flow Map) colors Spanish rivers by the magnitude of peak flood flow frequency.

The map is designed to provide an estimation of flood flows for general infrastructure work, where a high precision in the estimation of the flow is unnecessary. If you click on a section of a river on the map you can view an interpolation of river flow data for periods of 2, 5, 10, 25, 100 and 500 years. This data is also presented in the map sidebar as a bar chart.

Mapping German Farmers Markets


Zeit Magazin asked their readers in Germany to recommend farm shops & farmers markets and other locations where consumers can buy produce directly from food producers. Zeit Magazin has now mapped the over 5,000 recommendations it received from the survey.

Gehen Sie doch mal auf den Markt is a Mapbox map which shows the location of farms shops and farmers markets throughout the whole of Germany. You can filter the local food producers on the map by farm shops or farmers markets. If you select a marker on the map you can view the shop or market's opening times and view a list of the produce on sale.

понедельник, апреля 20, 2015

New Loch Ness Monster View


To capture Street View imagery in the Liwa Desert Google strapped a Street View Trekker camera to the back of a camel. It is only logical then that to capture Street View imagery of Loch Ness Google has strapped a camera to the head of the Loch Ness Monster.


The resulting imagery provides a partially submerged view of Loch Ness and its surrounding shores, all from the perspective of the Loch Ness Monster.

In reality, to provide new imagery from Loch Ness, Google captured some Street View imagery from a boat. The submerged shots were provided by the brave divers from the Catlin Seaview Survey.

Mapping Migrant Deaths Along the Mexican Border


Sleepless in Tucson has created a number of interactive maps exploring foreign national deaths along the Southern Arizona border with Mexico. The Southern Arizona Border post includes the above map showing the identifiable locations of migrant deaths crossing the border between 2001-2015.

The post also includes two heat-maps, One of the heat-maps shows where there is the highest and lowest density of deaths along the border. The second map shows the density of migrant deaths caused by hyperthermia. Hyperthermia is the number one cause of death of foreign nationals in the Southern Arizona desert.

It is hoped that the map showing deaths caused by hyperthermia can be used by organizations like Humane Borders to locate emergency water stations where they are most needed.


Drug Seizures Along the US-Mexico Border, from the Center of Investigative Journalism, examines the amount and types of drugs that have been seized being smuggled across the 2,000 mile border between the United States and Mexico.

The map plots 128,169 drug seizures made by the U.S. Border Patrol between Jan 2005 and Oct 2011. You can select which type of drug is plotted on the map (marijuana, cocaine, methamphetamine, heroin and other) using the buttons immediately beneath the map. The map also includes a timeline so that you can compare the number of each type of drug seized by year.

The amount of each drug seized at each U.S. Border Patrol checkpoint is represented by the size of the circle on the map. If you select a checkpoint station on the map you can also view details on the total number of seizures and the average weight of each seizure.

The Landsat 8 Cloud Cover Map


In March  the United States Geological Survey (USGS) and NASA began releasing Landsat 8 satellite imagery as a data-set on Amazon Web Services (AWS). Landsat on AWS provides free access to Landsat 8 satellite imagery. Landsat on AWS includes all Landsat 8 imagery from 2015 and a selection of cloud-free scenes from 2013 and 2014.

Every day new Landsat 8 scenes are made available, often within hours of production. The new 2015 scenes includes satellite imagery that contains cloud cover. Landsat Cloudcover is a CartoDB map showing cloud cover estimates for LandSat satellite photography sites globally.images across the world.

The choropleth layer shows the average percent of cloud cover that might obscure the image capture process.


Landsat is a partnership between the U.S. Geological Survey (USGS) and NASA that creates moderate-resolution (30 meter) satellite imagery of the Earth's land surface every 16 days. The imagery has been free to use since 2008. Now, thanks to AWS, developers can also avoid the cost of hosting the data.

An informative CartoDB animated map provides a nice visualization of how Landsat 8 Completes an Entire Picture of the World Every 16 Days. The map uses the new AWS Landsat data-set to show how Landsat captures fresh satellite imagery of the Earth's entire land mass over the course of 16 days.


If you want to explore the latest Landsat imagery in more detail you can view the newest imagery on Mapbox's Landsat-live. Landsat-live uses the latest Landsat 8 satellite imagery to provide a near real-time satellite view of the Earth at 30 meter resolution.

Because the map uses the most recent Landsat 8 satellite imagery many locations around the world will be affected by cloud cover. If you find your town is obscured by clouds you can always return to the map in 16 days time to see if the next pass of Landsat 8 has provided clearer imagery.