понедельник, сентября 30, 2024

The U.S. Supermarket Wars

map of the US with counties colored based on the spuermarket with the most stores

According to the Washington Post, "Walmart, Kroger, Aldi (Süd) and Albertsons own a third of all U.S. grocery stores locations." But who is winning the supermarket wars in your area?

Hot on the heels of Japan's ConbiniWars interactive map, the Post has divided the United States based on which supermarket chain owns the most stores in each county. Whereas the ConbiniWars map used a Voronoi layer to divide Japan based on the closest Konbini brand, the Post's Grocery Chains are Bigger than Ever map uses a form of choropleth layer to show which supermarket chains own the most stores in each county.

The Post's map lays bare the territorial dominance of Walmart, which has established a stronghold across much of the central United States. However, in the Northwest, Albertson's continues to mount a fierce defense, holding onto a fortified position in the face of Walmart's expansion. Meanwhile, Kroger has dug in deep, fortifying its lines throughout the mountain states, creating a well-defended bastion in this strategic region. Across other parts of the country, smaller chains are staging localized resistance, strategically counterattacking and holding their ground against Walmart's relentless march of conquest. 

If you want to see who is winning the supermarket war in your area, you can type in your address, and the Post will tell you the number of stores in your county and the share of those stores owned by each supermarket chain. The Post's supermarket data was derived from OpenStreetMap.

суббота, сентября 28, 2024

The Geotastic Daily Challenge

screenshot of a random Street View challenge on Geotastic

Can you beat me on today's Geotastic Daily Challenge? I am currently 89th in the Geotastic Daily Challenge with a combined score of 24,263. Do you think you have what it takes to claim a higher spot on the leaderboard than the mighty 'gmap'?

Geotastic is yet another online geography game that challenges players to identify locations around the world using Google's Street View imagery. Every day Geotastic sets a daily challenge which requires you to identify seven separate locations from only their Street View imagery. Today's Daily Challenge involves having to identify a number of locations with a 'concord' theme.

Alongside the daily challenge Geotastic also provides a number of other different Street View challenges. These include games involving famous landmarks around the world, head-to-head battles against other players and Cities of the World (restricted to major global cities).

Obviously Geotastic is another game which has been hugely inspired by the popular GeoGuessr Street View game. It now seems to have become my life's mission to discover GeoGuessr clones. Some of the games I have previously discovered can be found in the post Six Free Alternatives to GeoGuessr.

пятница, сентября 27, 2024

Cryptic Crossword Map

Cryptic World is a new unique map game that fuses the thrill of a geography quiz with the brain-teasing fun of a cryptic crossword! Play Cryptic World and discover how much of the world you can unlock!

Click on the question mark pins scattered across the Cryptic World map and solve the uncovered cryptic clues. Every time you correctly answer a clue you will reveal the name of a hidden location. 

Cryptic Crossword Clues: A Beginner’s Guide 

Cryptic crossword clues may seem puzzling at first, but they follow specific rules that make them fun to solve once you know how! Each clue consists of two main parts: a definition (which works like a standard crossword clue) and wordplay (a tricky way of getting to the answer). 

Tips for Solving the Clues

The key to figuring out most cryptic clues is working out which part is the definition and which part is the wordplay. In Cryptic World the definition is normally easy to spot. Because all the answers are locations then the definition will be geography related. In most Cryptic World clues the definition will most likely be either 'country', 'city' or 'town.

Wordplay Indicators

Solving the wordplay is a little more difficult. One way to solve the wordplay is to look for indicators. For example common indicators for anagrams are 'mixed', 'scrambled' or 'twisted'.

Here is an example clue from Cryptic World:

Crashes plane into mountainous land? (5)

In this clue 'mountainous land' seems like the most likely geographical definition. Therefore the answer is probably a territory, region or country with mountains. The word 'crashes' seems like an obvious indicator for an anagram. The word 'plane' has five letters so is most likely the word that needs to be rearranged (or crashed). If we rearrange the letters in 'plane' we get the answer to the clue - 'Nepal', a country which is a mountainous land.

Styled OpenFreeMap in Maputnik

I've had the idea of creating a cryptic world map for a while. However, to build the map, I needed a free source of unlabeled map tiles. Thanks to the launch of OpenFreeMap, I've finally been able to create Cryptic World. The map uses an OpenFreeMap style, which I customized in Maputnik to remove all the place-name labels.

Help Me! I'm Stumped!

Cryptic Clues can be very hard to solve for those who don't know the common indicators and some of the tricks used by setters. Minute Cryptic has a more detailed introduction to cryptic crossword clues which explores many of the common wordplay indicators used in cryptic clues (click on the question mark button).

If you are still stumped by a clue then use the comment section on this post to leave a question and I (and maybe other readers) will be happy to try and explain any clue that you are struggling with.

I definitely want to add more locations to the map. If you have a great clue for a place-name then please tell me in the comments.

Can I Start Again?

All your correct answers are saved in local storage. This means that when you return to the map it should still display all the place-names that you have already guessed. If you want you can clear all your correct answers and start the game again by typing 'shift-c'.

четверг, сентября 26, 2024

VersaTiles Free Map Tiles

map of Washington DC

Looking for a free, flexible way to create custom maps? You’re in luck! Having only recently discovered one free source of interactive map tiles in OpenFreeMap, I have now uncovered VersaTiles. VersaTiles provides a full open-source toolkit for creating and sharing map tiles, all powered by OpenStreetMap data - and with no corporate strings attached!

VersaTiles map tiles can be used in most of the popular mapping libraries, including MapLibre, by simply pointing the map to:

https://tiles.versatiles.org/assets/styles/colorful.json

At the moment Versatiles reports that "we can't guarantee 24/7 availability, yet". Personally, I think that is a small price to pay for a source of free map tiles. If you really need the security of a guaranteed service, then you probably should be using a commercial map tile service, such as Mapbox or Google Maps.

Like OpenFreeMap, the VersaTiles map can be styled in the Maputnik open-source visual editor. For example, the VersaTiles map currently doesn't appear to have place-name labels for countries. You could use Maputnik to import Country Name data and then add country name labels to VersaTiles. Then, by simply hosting the exported style JSON file, you could display a VersaTiles map with customized country place-name labels.

I have added VersaTiles to my growing demo of Free Maps. If you are interested in exploring more map tile providers, then you can explore the Leaflet Provider Demo list of map tile services.

среда, сентября 25, 2024

OpenFreeMap Map Styles

a world map with no labels

One very important feature I overlooked in the launch of OpenFreeMap is the ability to customize the styles of OpenFreeMap map-tile sets using the Maputnik open-source visual editor for the MapLibre Style Specification. If you have ever wanted to make your maps stand out, reflect your brand, or just look completely unique you can now do that for free by editing OpenFreeMap map tile styles with Maputnik.

OpenFreeMap "lets you display custom maps on your website and apps for free." Currently, OpenFreeMap offers four default styles: Positron, Bright, Liberty, and 3D. The appearance of these default styles can be customized using Maputnik. Maputnik is an open-source visual editor for creating and modifying Mapbox GL and Maplibre GL style JSON files, which define how maps are rendered. These styles control the appearance of vector tiles, including colors, fonts, line widths, and layers, allowing users to create custom map designs.

Once you have created your own style from an OpenFreeMap default style you simply need to export/download the JSON style. This JSON style can then be used with the MapBox and MapLibre map libraries.

Maputnik is very intuitive to use, especially if you've previously edited map styles using tools like the Google Maps Style Editor or Mapbox Studio. I've been using Maputnik for the first time this morning (with OpenFreeMap default styles), and I quickly managed to create a No Label and Toner map style. 

I've created a little demo OpenFreeMap Styles, which allows you to preview my No Label and Toner styles. You can even download the JSON files for these two styles if you want to use them in your own map projects (both styles were created very quickly this morning, so could definitely benefit from more refinement in Maputnik if you decide to use them in a project).

вторник, сентября 24, 2024

Konbini Wars

voronoi map of conbini stores in a district of Tokyo

Imagine being able to walk down any street and being only minutes away from your next snack, a freshly brewed coffee, or even a place to pay your bills. This is the magic of konbini - Japan's beloved convenience stores that have become an integral part of Japanese daily life.

In Japan, you don’t have to travel very far before encountering a konbini convenience store. These compact stores are renowned for their ability to provide an impressive variety of high-quality goods and services, despite their small size. Popular chains like 7-Eleven, Lawson, and FamilyMart are practically everywhere, offering unparalleled convenience at every corner.

The major chains like 7-Eleven, Lawson, and FamilyMart, are ubiquitous across the country; however, certain chains may have a stronger presence in specific regions due to historical, business, or geographic reasons. In addition to the big three (7-Eleven, Lawson, and FamilyMart), some smaller or more regional konbini chains operate in specific areas. While they may not be as common nationally, they are often beloved in their local areas. For example, the Seicomart chain is located mainly in Hokkaido and is well known for its local products.

If you are curious to see who’s winning the battle for Japan’s streets you can now discover which Konbini chains dominate which territory in Japan using the ConbiniWars interactive map. At the heart of the map are the locations of nearly 55,000 konbini stores across the whole of Japan. When zoomed out on the map, a choropleth overlay shows the konbini chain with the most stores in each prefecture. Zoom in on the map, and a voronoi layer appears that partitions the whole of the country based on the closest konbini chain.

понедельник, сентября 23, 2024

The 2024 GeoGuessr World Cup

 
Do you think you’ve got what it takes to be the next GeoGuessr World Champion?

This year's GeoGuessr World Cup was won by Blinky, who defeated the U.S.'s mk, to become the 2024 GeoGuessr World Champion. The dramatic final was a tense affair. Blinky took an early 2-0 lead, but mk made a stunning comeback winning the next two games, to take the competition into the fifth and final game. Despite mk’s brave efforts, Blinky managed to win the final game and claim the 2024 GeoGuessr world title​. 

If you want to compete in next year's GeoGuessr World Cup then you need to start your training now! Alongside a strict regimen of 10 practice rounds of GeoGuessr every day you will also need to spend 3-4 hours a day studying GeoHints.

licence plate designs from Italy, the Isle of Man and Jersey
GeoHints is a website designed to help players improve their skills at GeoGuessr. The site offers a wide range of visual clues that players can use to determine their location in the game. These include detailed information on the visual and design differences in street signs. street furniture, architecture and landscape features in countries around the world.

While watching GeoWizard play Geoguessr I am always amazed at his encyclopedic knowledge of license plate designs and road lane markings. Knowledge that he calls on to help determine which country he has been dropped in on GeoGuessr. In order to become as geographically knowledgeable as GeoWizard and this year's GeoGuessr World Cup finalists, I recommend that you spend a solid 3-4 hours each day studying the many visual clues covered by GeoHints.

суббота, сентября 21, 2024

Urban Planning in 3D

a 3d mapped tour of the redevelopment of Bois du Château

The Studio Carto is a French design company dedicated to creating innovative experiences in the visualization of architectural, urban, and territorial projects. The company uses interactive maps to explore the challenges involved in transforming environments.

The Studio Carto - Urban Project is a beautifully realized interactive presentation of the planned redevelopment of the Bois du Château district in Lorient. The district was built in the 1960s during the reconstruction of Lorient. Now a huge renovation project is transforming the district with new housing, parks and local facilities.

You can explore the renovation plans for the Bois du Château on Studio Carto's superbly designed interactive map. Urban Project uses the Maplibre GL mapping library to present an amazing 3D tour of the district's redevelopment. The map utilizes Maplibre's 3D mapping capabilities to create a fly-through tour of some of the renovation projects that are transforming this district of Lorient. The whole tour takes place on a beautifully stylized 3D map of the Bois du Château redevelopment plans.

Presenting the redevelopment plans through the use of a 3D map in this way provides an immersive, interactive experience, allowing the district's residents to visualize the proposed changes to their neighborhoods in a way that is easy to understand. It enables a detailed exploration of the proposed changes from different angles, enhancing clarity and transparency. It also fosters engagement by allowing residents to better visualize the potential impact of the redevelopment firsthand.

пятница, сентября 20, 2024

Free Maps for All

All my recent personal map projects (Scrambled Maps, Backdrop, World Level Zero, Guess This City) are available for free online. However, because I make zero money from my maps, I cannot afford to host them myself or pay a provider for the map tiles that they use. This means I have to be a little creative in publishing my maps online.

Thanks to the amazing Glitch and the generosity of TripGeo I am able to host my maps online cost free. 

Map tiles, however, are a little more difficult. I cannot afford to pay Google, Mapbox, Esri or any of the other map tile providers for map tiles. That is why I often find myself browsing the Leaflet Provider Demo map. This map is a fantastic source for map tile layers which are not password or key protected.

However, just because these map tiles are not password or key protected does not strictly mean that you are free to use these map tiles in your own maps without paying for the privilege. If you use these map tiles in your maps without paying, then the providers will incur the hosting costs. I try not to rely too heavily on these unprotected map tile services just because they are unprotected. The same goes for hot-linking to the OpenStreetMap map tiles and passing on your map tile costs to OSM.

I am, therefore, delighted to report that there is now a new free map provider on the market. OpenFreeMap provides ...

"free map hosting so you can display custom maps on your website and apps.

It is truly free: there are no limits on the number of map views or requests you can make, nor on how you use your map. There is no registration page, no user database, no API keys, nor cookies."

The OpenFreeMap map tiles are vector tiles, which means that they are perfect for use with the open-source MapLibre map library. In fact, the example given in the Quick Start Guide shows you how to use the tiles with MapLibre. The guide also says that a Leaflet based example is coming soon. If you are already familiar with Leaflet, you might not need the guide. Even though there is yet no Leaflet example, I was quickly able to get the tiles to work in Leaflet by using the Maplibre GL Leaflet library.

The launch of OpenFreeMap is exciting news for online map developers. It is a fantastic resource for 'hobby' projects like mine which can now be developed and shared without having to worry about map tile costs or map tile limitations.  

четверг, сентября 19, 2024

Crowdsourcing Neighborhood Borders

Is your neighborhood where you think it is? In a world where cities are constantly changing, the power of crowdsourcing is helping redefine neighborhood borders. While official maps draw static lines, the people who live in these urban spaces often see things differently. What one person considers the "end" of their neighborhood could be another's starting point, creating a patchwork of local perceptions that blend and shift over time.

As cities like Boston, New York, and San Francisco evolve, their neighborhoods aren't just defined by geography—they're shaped by culture, identity, and the personal stories of the people who call them home. From the bustling streets of Manhattan to the rolling hills of Edinburgh, crowdsourced maps are offering a new, dynamic way of understanding the cities we live in.

Boston

crowdsourced map of Boston neighborhoods

Bostonography may have been the first to try and crowd-source neighborhood boundaries, with their project to find out where residents believe Boston's neighborhood boundaries lie. Crowdsourced Neighborhood Boundaries used an interactive Google Map to record the drawn borders of Boston neighborhoods as submitted by Bostonians.

Bostonography then created a neighborhood map of Boston neighborhoods based on the amalgamated responses. The results for each neighborhood were also analyzed to determine which neighborhood boundaries had a strong agreement response and which neighborhood boundaries had the least consensus.

New York

map of New York showing crowdsourced borders of city neighborhoods

Back in 2015 DNAInfo asked New Yorkers to draw their neighborhood boundaries on an interactive map. More than 12,000 people outlined where they thought their neighborhood's borders existed. Adam Pearce then used this data to create a map of New York Neighborhoods Drawn by New Yorkers. This interactive map provides an interesting visualization of where New Yorkers believe their neighborhoods begin and end.

Edinburgh

Map of Edinburgh showing the crowdsourced borders of city neighborhoods

In the UK the popular classified website Gumtree used to ask users to enter their neighborhood and postcode. The interactive map Neighborhoods of Edinburgh used this data to create a crowdsourced map of Edinburgh neighborhoods. If you click on an outlined neighborhood on the Neighbourhoods of Edinburgh map you can view the individual points that have defined its boundary.

The Neighborhoods of Edinburgh map does allow for outliers. If you click on a city neighborhood you will likely see a few red dots indicating responses which the Neighborhoods of Edinburgh creators have identified as 'outliers' and have ignored in creating the neighborhood boundaries. However there doesn't appear to be any explanation of the methodology used to determine which data points were excluded from the crowdsourced neighborhood data.

San Francisco

map of San Francisco showing crowdsourced borders of the city's neighborhoods

The Neighborhood Project also uses a classified listings website to gather data on city neighborhood boundaries. It uses the address and neighborhood data used on housing posts on craigslist, from people living in San Francisco.

Using the single coordinates from each craiglist post the map then applies a 'blobby' algorithm to create local San Francisco neighborhoods. Each point in a neighborhood acts as a little magnet, and "the neighborhood is the region where the combined attraction of all those magnets is above a certain strength. A single point makes a small circle on the map. The influence of a number of nearby points will combine to make a curved blob" defining the boundaries of the neighborhood.

среда, сентября 18, 2024

15 Minutes Cities by Sony CSL

hexbin map of San Francisco and Oakland showing average travel times to essential services
Sony Computer Science Laboratories in Rome have released a new interactive map which provides 15 Minute City accessibility scores for nearly every city in the world. The '15-minute city' is an urban planning concept aimed at designing cities in a way that ensures residents can access most of their daily needs—such as work, shopping, healthcare, education, and recreation—within a 15-minute walk or bike ride from their homes. It seeks to create more livable, sustainable, and community-oriented environments where essential services are easily accessible to residents.

Select a city on the new 15min-City map and you can view a hexbin map of the city showing how accessible services are from each hexagonal area. The color of each hexagon on the city map corresponds to the number of minutes it takes to access a number of essential services by foot or bike. You can color the hexagons by either walking or cycling time and you can also select to view the accessibility times of individual category of service (outdoor activities, learning, supplies, eating, moving, cultural activities, physical exercise, services, healthcare).

If you live in the United States you can also refer to the Close interactive map which allows users to discover walkable, bikeable, and transit-friendly neighborhoods across the country. Close allows users to select the amenities & destinations which are important to them and then it creates a US travel-time map based on walking, biking and public transit travel times to those destinations. Which means you can quickly find your ideal 15 minute neighborhoods in towns and cities across the whole U.S..

вторник, сентября 17, 2024

World Level Zero

map of the world with some countires colored in

How well traveled are you?

My new map World Level Zero turns your travel experiences into a global achievement tracker. Whether you've been globetrotting for years or are just getting started, World Level Zero allows you to plot your personal journey across the globe and turn your wanderlust into a tangible score.

What Is World Level Zero?

At its core, World Level Zero revolves around a simple concept: players use an interactive world map to mark the countries they’ve visited, lived in, or simply passed through. As you chart your travels, the game rewards you with points for each location. It doesn't matter whether you've spent years in a country or had a brief layover — every experience adds to your overall score.

But that’s not all. The game also calculates your World Level, a score that reflects how well-traveled you are based on the number of countries you've checked off. The more countries you visit, the higher your World Level climbs, taking you from a novice explorer to a seasoned world traveler.

How It Works

1. Points System: Each type of visit to a country comes with a different points value. For instance, visiting a country gives you fewer points than living in one, while simply passing through nets you a smaller score.

2. World Level Progression: Your World Level grows as you accumulate more points. Initially, you'll start at "World Level Zero," but as you mark more locations, your rank increases.

More Travel Trackers

World Level Zero is inspired by the China Hegemony Generator. The China Hegemony Generator is a very similar interactive map which scores your travels in China based on which provinces you have visited. The China Hegemony Generator has inspired a number of imitators, including US Level (tracking the US States you have visited) and Europe Level (tracking European countries visited).

понедельник, сентября 16, 2024

Every Basketball Court on Google Maps

The Pudding has mapped Every Outdoor Basketball Court in the U.S.A.. I'm not sure why The Pudding decided to collate satellite imagery of every basketball court visible in Google Maps' aerial imagery but it is quite fun to play with.

My guess is that Every Outdoor Basketball Court in the U.S.A. is an experiment by The Pudding in using computer vision to detect, recognize and classify objects in large-scale imagery datasets. The use of AI-powered object detection in satellite imagery has become a useful tool and The Pudding's Basketball visualization is an interesting experiment in how the results of a remote sensing search of an area can be sorted and organized.

The 'about' section of Every Outdoor Basketball Court in the U.S.A. declares 'Court Locations via Open Street Map. Satellite imagery via Google.' It is possible that the Pudding could have used something like Overpass to search for basketball courts on OSM instead of using AI object detection. However the presence of a number of false positive images of satellite images of shapes which closely resemble basketball courts leads me to suspect that some form of machine learning trained on Google's satellite imagery was used to collect this data.

Anyway, if you are looking for an outdoor court in your area, you can simply type your address into The Pudding's visualization to find all your nearby basketball courts. Or, if for some reason you only like playing basketball on a particular color of court, you can also sort all the outdoor basketball courts in the USA by color.

суббота, сентября 14, 2024

Scrambled Maps on Toast

a map of Wyoming with all the map tiles mixed up

I have a new favorite daily breakfast map game. Everyday my espresso and avocado toast is now served with a side dish of Scrambled Maps.

Scrambled Maps is a new daily map challenge. Everyday Scambled Maps presents you with a map of a different city of the world. The only problem is that all the map tiles on this city map have been mixed up. Your task is simply to drag the tiles back into the correct order. Restore the map to its original state and you win the game.

I'm still working on making the game responsive to different screen sizes. For now you might need to avoid playing the game on a mobile screen and instead use a computer or tablet. You might also find it helps to click on the full-screen button in the top-left corner of the game.

Scrambled Maps is the latest in a series of map games from TripGeo. You might also like Guess This City, Backdrop and TripGeo Trivia.

пятница, сентября 13, 2024

Create an AI Poster for Your Location

a map of London next to an AI generated poster for London, featuring red buses, phone boxes and Big Ben

The Global Culture Map is a fun little tool which uses AI to create a poster for any location chosen on an interactive. Simply click on the Global Culture Map and it will use a generative AI to design a poster based on that location.

Currently I would say that the Global Culture Map is an interesting fun experiment rather than a completed, fully-realized AI poster creation tool. At the moment the map poster creation tool doesn't have an 'about' page so I don't know for sure which AI is being used to create the posters but the text errors in some of the 'Recently Generated Images' suggest that Midjourney is the generative AI creating the completed posters.

The text errors on some of the created posters are one example of why you probably won't want to actually print out a Global Culture Map completed poster and hang it on your wall (I think the text errors could be overcome fairly easily by allowing users to add their own text on top of the AI generated posters). As the Global Culture Map is using an AI to create posters it also makes sense to allow users to choose their own 'style' prompts for the AI generated posters so that users aren't restricted to the generic 'poster' style prompt currently being used by the tool.

Despite these quibbles I think the Global Culture Map has a lot of potential to become an impressive location based poster creation tool. One that could be easily monetized by allowing users to order prints of their poster designs (see Mapiful as an example)

If you want to create an actual map poster (featuring actual maps of your location) then you might also like these other map poster tools:

Prettymapp
Figureground Posters
Street Patterns

четверг, сентября 12, 2024

The EJAtlas: A Map for Environmental Justice

Around the world the ever demanding quest for economic growth and profit is having an impact on natural environments. The result is that local communities and groups are often forced into fighting governments and multinational companies in order to try to save their local environments from the eternal forces of 'progress'.

The Environmental Justice Atlas has set itself the task of documenting and mapping these social conflicts centered around environmental issues. The EJAtlas interactive map highlights the struggles of different communities around the world for environmental justice. It aims to make these protests more visible and amplify the voices of those affected, ensuring their stories reach a global audience. By doing so, it seeks to foster greater awareness and understanding of the injustices faced by marginalized communities, build solidarity among those fighting for their rights, and promote accountability from corporations and governments responsible for environmental harm.

Environmental conflicts are shown on the map using colored map markers. The colors of the markers reflect  different categories of conflict, including nuclear, water management and mineral extraction. The map also features a number of filters which enable you to adjust the environmental conflicts displayed on the map by category, population, type of project, type of protest and environmental impact.

The Featured Maps section of the EJAtlas showcases a number of interactive maps focused on specific thematic or regional maps concerned with particular environmental justice issues, conflicts, or regions. These maps are curated to showcase selected cases or topics that deserve special attention due to their significance, scale, or urgency.

среда, сентября 11, 2024

The Map to the White House

NBC has launched the 2024 edition of its Road to 270 interactive electoral college map. The map visualizes the current likely, possible and fantastical outcomes of the 2024 U.S. Presidential race. Last night Kamala Harris and Donald Trump went head-to-head in their first presidential debate. The Philadelphia debate was a hugely significant opportunity for both Harris and Trump to present their case for the presidency.

Following the debate you can now use ABC's map to predict the result of November's election. You can click on individual states on the map to predict whether you think they will swing for either Harris or Trump. The map will then automatically assign that state's electors to the chosen candidate and tally the total number of votes of each candidate. A candidate needs at least 270 electoral votes to win the 2024 presidential election.

As well as allowing readers to predict their own electoral map NBC has also mapped out a number of possible outcomes. Steve Kornacki's 'electoral tie' map outlines a theoretical drawn outcome where both candidates receive 269 electoral votes (in which case the deadlock would be broken by the House of Representatives). Kornacki has also mapped out Trump and Harris' most likely direct path to the White House, while Kristen Welker has mapped out scenarios for 'Trump's Dream Path' and 'Harris' Dream Path' to the Presidency.

If you want to know how last night's debate has affected the possible results of the election then you can also refer to 538's Who Is Favored To Win The 2024 Presidential Election? (although at the time of writing 538 has yet to update with the results of the post-debate polls - but I am sure it will update soon). 

If you click on a state on the 538 map you can discover how many electoral votes are up for grabs in the state and which candidate is most likely to win those votes based on the polls and 538's election simulations. 538's simulations are based on extensive polling, economic and demographic data, 

вторник, сентября 10, 2024

Tracking Russia's 'Dark' Shadow Ships

Asya Energy's AIS track places it in the Norwegian Sea, at the same time satellite imagery shows it at the ALNG2 plant

In response to Russia's invasion of Ukraine the West has imposed sanctions on the sale of Russian oil. In an attempt to avoid these sanctions Russia has been operating a shadow fleet of covert oil tankers. The West has been working on strengthening international cooperation to try to limit the use of these covert oil tankers.

SynMax claims that Russia is also developing a 'shadow' fleet of Liquefied Natural Gas (LNG) tankers. In The Inception of Russia’s LNG Ghost Fleet SynMax maps out how a number of LNG tankers have been using AIS spoofing tactics in order to conceal their visits to Russia's Arctic-2 LNG Export Plant. (ALNG2)

At the same time as their spoofed AIS tracks show them supposedly in the Norwegian Sea a number of LNG tankers have been spotted on satellite imagery by SynMax actually at the ALNG2 plant 800 miles away. These ships are part of a dark fleet assembled by Russia’s Novatek to avoid sanctions imposed on transporting cargoes from ALNG2.

Alongside the AIS spoofing activity mapped by SynMax these ships also show a common pattern of frequent changes in ownership, vessel names and country registrations. All common tactics used by tankers trying to avoid sanctions on the sale of Russian oil and LNG. At least one ship has also been tracked taking the perilous sea route south through the Red Sea. SynMax speculates that "Russia may have negotiated a deal with Yemen’s Houthis ... allowing for “safe passage” through the Bab el Mandeb Strait". 

понедельник, сентября 09, 2024

AI Search of San Francisco

AI and machine learning are revolutionizing the field of remote sensing. The ability of machine learning algorithms to automatically detect and identify objects in satellite images has enhanced our abilities to monitor deforestation, identify illegal fishing, track wildlife, and more quickly implement disaster response.

Thanks to AI it is now also possible to see who owns a Tesla car in San Francisco. Bluesight.ai has released a new interactive map to demonstrate how objects can be identified in aerial imagery of San Francisco. Using natural language searches it is possible to explore the Blue Explorer map for things like Tesla cars, dry patches, boats, and tennis courts. Just type your search criteria into the Blue Explorer search box and the AI will automatically search the aerial imagery of San Francisco and show the results highlighted on the interactive map.

Some other recent examples of machine learning being used to search aerial imagery include OneSoil (which uses AI to detect where different the types of crops are being grown), Земляна проказа (identifying illegal amber mines) and Curio Canopy (identifying tree canopy cover in European cities).

Robin Wilson also recently  released an impressive Aerial Image Search Demo which allows you to explore an AI image search of aerial imagery in the UK port town of Southampton. Clay Explore is another impressive interactive AI map demo, allowing you to search aerial imagery of Southern California, Seoul and Puerto Rico using machine learning.

суббота, сентября 07, 2024

China vs America - World Influence Map

The Global Influence Index (GII) shows the influence of the United States and China on 191 countries around the world based on 28 different economic, security, and political criteria. Using the GII's new 3D globe you can tell at a glance where in the world either the U.S. or China has the greatest influence.

Individual countries on the GII globe are colored to show whether they are aligned more with China or the U.S. (green being U.S. aligned and red being aligned with China). If you select the 'stories' button you can view a number of guided tours of the influence that China and the United States hold in different regions of the world (including Africa, the Middle East, Europe, Latin America and the Indo-Pacific).

According to the GII currently the United States holds sway in Europe. This is based partly on the strong historical ties between Europe and the U.S. but also on Europe's growing concerns over the strategic threat posed by China. In many other regions of the world, for example in Africa, the U.S. is losing the influence battle to China. According to the GII China has pursued 'sustained and deliberate engagement with nations throughout Africa', which is reflected in its growing influence in the region.

According to the GII the 'Indo-Pacific is the epicenter of strategic competition between the United States and China'. Australia, India, South Korea and Japan retain very strong economic and strategic ties with the United States. However many other countries in the region are developing very strong ties with China.

A full breakdown of the variables and methodology used to determine the influence scores of each individual county are available on the about section of the GII website.

пятница, сентября 06, 2024

2024 Fall Foliage Map

animated map of the usa showing the spread of Fall Colors in 2024


Autumn is nearly upon us. Although the Autumn Equinox is not until the 22rd September the 2024 Smoky Mountain Fall Foliage Map shows that the most northern counties of the United States will already have begun to notice the colors of the leaves changing.

Every year Smoky Mountain releases an interactive Fall Foliage Map, which plots the annual progress of when and where leaves change their colors across the United States. According to the map some northern states will already have begun to notice a change in the colors of leaves. 

The Fall Foliage Map uses historical weather records from all 48 continental states to predict the arrival of Fall at the county level across the contiguous United States. The map includes a date control which allows you to view the leaf color you can expect for any date from the beginning of September through to the end of November.

четверг, сентября 05, 2024

The Book Banning Map of America

choropleth map showing the number of books attempted to be banned in each US state

The American Library Association (ALA) reports that attempts to ban books "surged 65% in 2023 compared to 2022 numbers, reaching the highest level ever documented by ALA." Nearly half of the books targeted for banning were related to issues of LGBTQ+ communities or race.

Now the ALA has partnered with Little Free Library and PEN America to release an interactive map which shows the number of books which have been targeted for bans in every US state and county. The map also shows the locations of Little Free Library’s book-sharing boxes.

The Little Free Library is a nonprofit dedicated to encouraging the free exchange of books through small, community-run book-sharing boxes. These book-sharing boxes can be placed by anybody in any accessible location, like a neighborhood park or outside a local store. Using the boxes people can take and leave books, encouraging reading, and making books freely available to everyone.

The Book Ban Map has now been released to show "the areas hit hardest by book bans and the nearest Little Free Library book-sharing box locations". The burger menu on the map allows you to switch between viewing the number of books which were attempted to be banned at either the state or county level. The county data is from PEN America’s 2022- 2023 Index of Book Bans (which is a compilation of attempted book bans reported in schools). The state data is from ALA’s Book Ban Data (which lists attempted book bans in public schools and libraries across the United States.

The blue markers on the map show the locations of Little Free Library boxes across America. Click on these markers and you can view the library's charter number, which can also be used with the Little Free Library World Map.

среда, сентября 04, 2024

Write Your Name in Landsat

the word love spelled from Landsat images that look like letters
the word 'love' in Landsat images

Soon after the emergence of Google Maps, a short while after getting bored zooming in on their house in satellite view, some people began searching for satellite images of Earth forms and patterns which resembled letters of the alphabet - when viewed from above.

The first pareidolia sufferer that I can remember becoming hooked on discovering typefaces in nature is Rhett Dashwood. In 2009 Rhett published his Google Maps Typography, a collection of 'land formations or buildings resembling letter forms' all found on Google Maps from the satellite images of Victoria, Australia.

a digital clock made from satellite images which resemble numbers

A couple of years later Che-Wei Wang and Taylor Levy, by now bored of looking for letters, began searching for numbers in satellite imagery. Having found the 10 decimal digits (0-9) they took the next logical step and created the Earth Clock. The Earth Clock (previously the Google Earth Clock) is an online digital clock which uses satellite imagery resembling numbers to display the current time where you live.

Now NASA, having become bored staring into the vast void of space, has also turned its attention towards searching for satellite views of Earth which resemble letters. Landsat satellites have been observing Earth from space for over 50 years. During that time NASA has found a number of locations around the world which, when viewed from space, resemble letters.

Using these locations NASA has created Your Name in Landsat. Type a name into Your Name in Landsat and you can observe your name spelled out in Earth features found in Landsat images.  You can even download an image of your name spelled out in massive Earth letters by simply pressing the download button. Hover over the individual satellite images spelling your name and you can discover where in the world each giant letter can be found.

вторник, сентября 03, 2024

Mapping Moving Borders in Real-Time

3D map of Mt. Similaun, Italy

The international border between Italy and Switzerland & Austria in the Alps largely follows the path of the watershed line. Unfortunately due to global heating and shrinking glaciers the Alpine watershed line keeps on moving. The result is that the border between Italy and its Alpine neighbors is also constantly moving.

In 2016 the Italian Limes project attempted to track the movement of the Italy-Austrian border in real-time. In order to do this it installed 25 sensors on top of a glacier at Mt. Similaun. Every two hours these sensors recorded and transmitted their positions. This allowed the moving border between Italy and Austria to be updated and mapped in near real-time.

map of the 25 sensors on Mt. Similaun
3D map showing the position of the Italy-Austria border in 1920 and 2016 and the position of 25 border sensors

The Italian Limes project is beautifully illustrated using a 3D map of Mt. Similaun. On top of this map you can view the Italy-Austrian border in 1920 and the border's position in 2016. The map also shows the location of the 5x5 grid of GPS units which were used to track the glacier's movements in three dimensions in near real-time.

Via: The Visualising Data Newsletter

понедельник, сентября 02, 2024

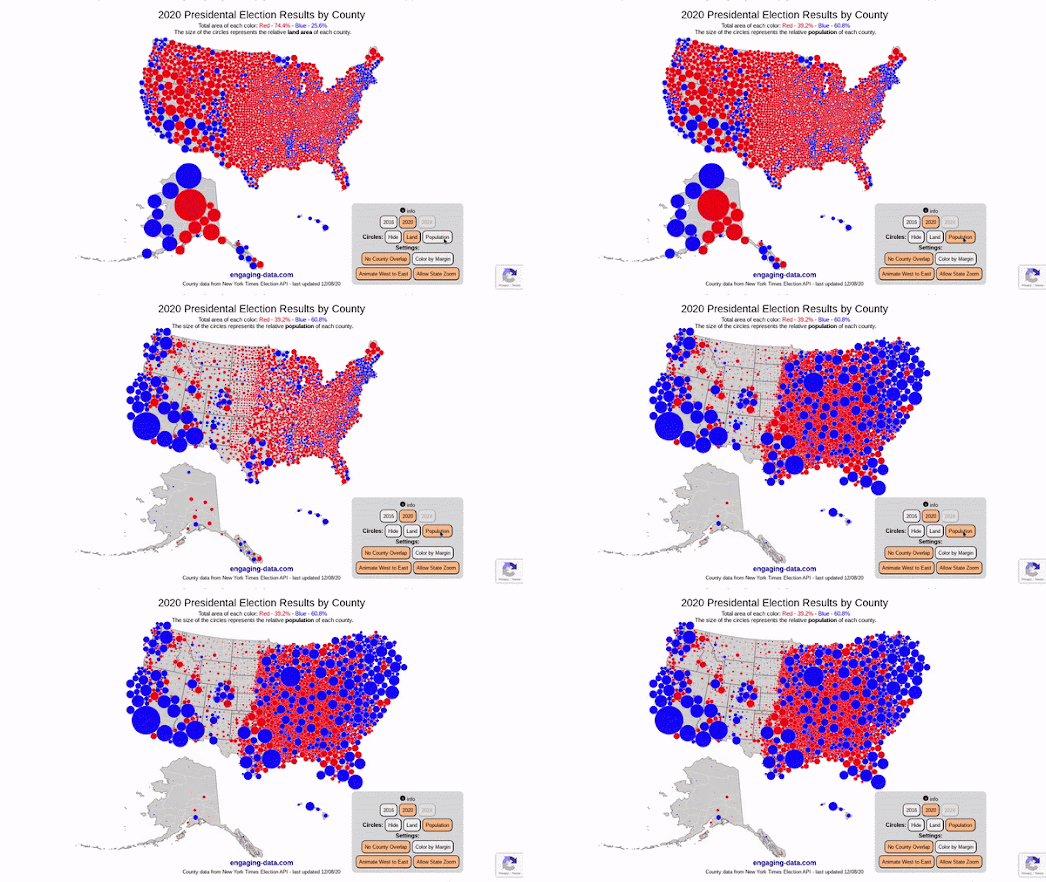
Land doesn't vote, people do!

map of 2020 Presidential Election election results at county level

Engaging Data has updated its US County Electoral Map – Land Area vs Population map so that you can now zoom in and explore the election results in each state. The map allows you to see the 2020 Presidential Election election results at the county level based on land area or population size.

If you select the 'Population' button on the map then the colored proportional circles change size to represent the county population size. Switching between the Land and Population buttons provides a dramatic illustration of how the same data can be visualized in radically different ways.

As Kenneth Field recently explained to Wired "People see maps of any type, and particularly election maps, as the result, the outcome, but there are so many different types of maps available that can portray results in shades of the truth." The Wired article Is the US Leaning Red or Blue? It All Depends on Your Map explores a number of different mapped visualizations of the 2016 Presidential Election to help illustrate how different map methodologies can tell very different stories. You can explore most of these maps in closer detail at Thematic maps of the 2016 Presidential election.

2024 UK Election cartogram map
After the recent UK election nearly every election map I saw in the media included a cartogram view of the results. Similar to the US (and many, many other countries) in the UK sparsely populated rural areas tend to vote more right-wing, while more densely populated urban areas vote in greater numbers for parties of the left. 

To overcome the problem of showing most of the country dominated by the blue of the losing right-wing Conservative Party most maps of the 2024 UK General Election included a cartogram view which represented each electoral area as an equal-sized hexagon. As you can see in the example above an equal sized hexagon map does a very good job in reflecting the actual number of winning candidates for each of the UK's political parties. The compromise of course is that a cartogram is not as geographically accurate as many other methods of mapping election results.