пятница, декабря 31, 2021

The 50 Best Maps of the Year

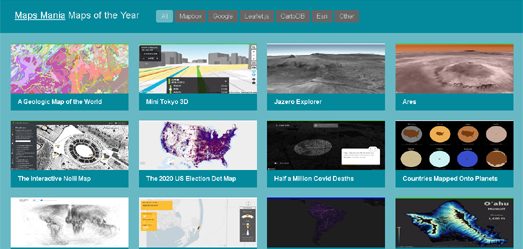
The Maps Mania round-up of the best Maps of the Year 2021 is out now!

Before you view this round-up of the 50 Best Maps of the Year I have a small disclaimer: 

  • There aren't 50 maps in this list. 
  • The maps listed are not the best maps of the last 12 months. 
  • Some of these maps probably weren't even released in 2021. 

The Maps of the Year 2021 could more accurately be described as 'a collection of the 48 interactive maps  which made the biggest impression on me during the last 12 months'. 


If I was forced to pick one interactive map which made the biggest impact in 2021 I would probably choose Sam Learner's River Runner. River Runner is a very clever map which uses U.S. watershed data to calculate the route that a drop of rain would take from any location in the United States to the ocean. The map uses Mapbox's elevation data and the USGS's national hydrology data to animate the incredible journey of a single drop of water to the sea. 

Although River Runner might be my personal pick for Map of the Year it wasn't the most popular map on Maps Mania in 2021. That award goes to the Magic Mushroom Map. I probably wouldn't pick this map as one of my favorite maps of the year but for some reason the Maps Mania post on the Magic Mushroom Map was by far the most read on this blog during the past year. For some reason (especially in the Fall) a lot of people were interested in exploring a map which shows where and when magic mushrooms are in season near their homes.

My Maps of the Year 2021 list allows you to filter the interactive maps displayed by the map library used to create each map (Mapbox, Google Maps, Esri, Leaflet and Other). When I first used this filter on my Maps of the Year list in 2014 a small  majority of maps were created using the Google Maps API. This year only one map in my Maps of the Year list was created using the Google Maps API (Moving Hamburg). The fact that the vast majority of the interactive maps in this year's Maps of the Year list were created on the Mapbox GL platform is obviously a reflection of the dramatic shift in the use and influence of these two mapping platforms in the last few years. 


This year's list also includes a significant number of maps made by 'Other' mapping libraries. Among these are a number of very impressive animated 3D maps / models which were created by online news websites to illustrate important stories. These include:

To this list I could have probably added a number of other 3D animated maps created by the New York Times (however those maps are all hidden away behind a paywall).

If I've failed to link to your favorite interactive map of 2021 feel free to berate me in the comments below and leave a link to your favorite map(s).

Real-Time Map Annotations

The JavaScript image annotation library Annotorious has created a demo application which allows you to annotate a map in real-time in collaboration with other users.

You can view the Annotorious real-time annotation demo in action on this Thayer's Map of New Mexico. Using the drawing tools provided you can highlight any area on this vintage 1880 map and add your own annotations. Share the URL of the map with your friends and they can then click on the areas that you have highlighted to read your annotated notes. They can even add their own annotations to the map. 

The Annotorious demo works with any map which has a IIIF manifest (for example most of the maps in the David Rumsey Map Collection). Here is an example using the 1633 Nova Yirginiae Tabula from the David Rumsey Collection. To create this map I just cut & pasted the id number of the map (from the map's IIIF manifest) into the Annotorious demo URL. Each time you add a new manifest ID to the URL you create a new instance of the Annotorious demo.

The map doesn't have to be from the David Rumsey collection. You can use any IIIF manifest with the Annotorious demo. You don't even have to use a map, as you can use the IIIF manifest of any image. For example here is an image annotation demo using a Van Gogh self-portrait.

среда, декабря 29, 2021

Mapping the Weather Around Me

I'd quite like to get out of London for New Year's Eve. Consulting WhereTo shows me that many of the cities within a 200km drive from London are expecting rain on New Year's Eve and /or New Year's Day. Birmingham and Bristol are forecast rain on both days. Coventry and Leicester are forecast rain on New Year's Eve, and Southampton and Portsmouth are forecast rain on New Year's Day. 

If I want to avoid the rain this weekend then I need to head to Reading or Nottingham. These are the only two cities within a 200km radius currently forecast to have no rain on either New Year's Eve or New Year's Day. 

If you are thinking of taking a mini break in the next week then you can also use WhereTo to find the city with the best forecast weather within a defined distance of any location. WhereTo is an interactive map which allows you to check the weather forecast in the largest cities within a given radius of the location of your choice. 

Click on the WhereTo interactive map and it will find the ten biggest cities in a radius around that location. The map sidebar will then display the weather forecast in those cities for the next eight days. A slider control at the top of the map sidebar allows you to adjust the size of the radius within which you wish to search. WhereTo uses the Openweathermap API to display weather on a Leaflet.js interactive map. You can explore the mechanics of WhereTo in closer detail for yourself on the map's GitHub page.

вторник, декабря 28, 2021

Mapping the Polar Heat Cap

Kenneth Feld of Cartoblography has published his list of his Favourite Maps 2021. His selection of some of the best maps of the past year includes Greg Fiske's visualization of the Polar Heat Cap for the Woodwell Climate Research Center. 

Update: Greg has now released an interactive version of his Warming of the Arctic by 2060 map. This interactive version of his polar heat cap visualization uses the Esri mapping platform to show the disproportionate warming of the Arctic compared to the global average.

In Understanding the global threat of a rapidly warming Arctic the center explains how Arctic regions are warming at a much faster rate than the global average. Greg's distorted 3D globe uses elevation to visualize the disproportionate effect of climate change on the Arctic compared to the rest of the world. On this globe elevation visualizes projected global temperatures in 2040-2060.

Temperatures in the Arctic have already warmed at a faster rate than the global average. This can be seen on Aodhan Sweeney's visualization of A Century of Surface Temperature Anomalies. Sweeney's webGL globe uses NASA GISTEMP v4 data to show how temperatures on Earth have changed over the past century.

On Aodhan's interactive globe height bars are used to show global temperatures. Again the use of a 3D globe provides a very effective visualization of the Polar Heat Cap. The red height bars on this webGL globe clearly show how the Arctic is already warming at a faster rate than in most other regions around the world.


The Maps Mania round-up of the best Maps of the Year 2021 is also out now!

среда, декабря 22, 2021

Hologram Cities

Digital City is an impressive experimental map which uses OpenStreetMap data to create a 'hologram style' map "showcasing the connectivity of people within a modern urban area'. 

Visit Digital City and you can choose to view hologram style maps of either New York, London or Dubai. As you can see from the GIF above each city is visualized with pulsating colors to create a hologram style effect. This sci-fi ambience is enhanced by the addition of a spectral sound-track to each map. You can actually pan around each city map and even click on certain city landmarks to view contextual information.

The three city maps were created using OpenStreetMap location data with three.js.

понедельник, декабря 20, 2021

Mapping the Global Climate Crisis

Last week I reviewed CrisisGroup's interactive map How Climate Change Fuels Deadly Conflict. On this map CrisisGroup shows where in the world climate issues, like water scarcity and climatic volatility are leading to conflicts between different communities and countries.

You can also explore the impact that climate change is already having on people across the world on the Communities in Crisis interactive map. Communities in Crisis is a new online book which looks at the impact that climate change is having on communities around the globe. The book consists of 12 chapters, each of which deals with a specific threat from climate change, including threats such as rising sea levels, drought, extreme heat waves and food and water insecurity.

Each chapter on a specific climate change threat is made up of a collection of essays, written by students at Penn University. These essays examine individual communities around the world which are being impacted by global heating. For example the opening chapter looks at communities which are suffering from drought. This chapter includes a number of essays, including an essay outlining the conflicts between farmers and the Mexican government in the State of Chihuahua, Mexico. Two people have already been killed by the National Guard during protests against the La Boquilla Dam and the exporting of scarce water supplies to the USA.

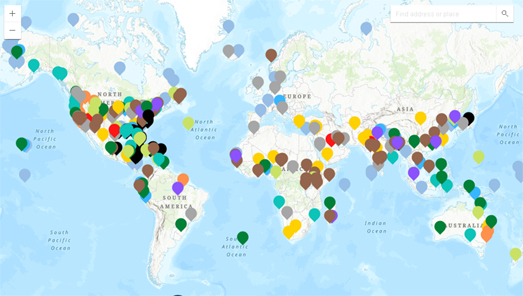
The interactive Communities in Crises Map at the beginning of the book provides an overview of communities around the world who feature in the online book. It also allows you to navigate the individual essays featured in the book by location. If you select a marker on this map you can click through to read the climate crisis essay written about that specific community.

суббота, декабря 18, 2021

Santa's Wish Tracker

Have you written to Santa yet? Don't worry if you haven't because you can now send your wishes to Santa on a Google Map.

Enter your wish into the Ubilabs Christmas Wish Tracker and you can follow its journey all the way from your home to Santa's post office in Finland. After you share your wish and location with the Wish Tracker you can view an animated map showing the journey of your wish being transported around the world on its way to Finland. 

On this journey your wish will be transported by plane, boat, bluebird, train and reindeer. Your wish will also stop at a number of different locations around the world before it arrives in Finland. These locations include a Christmas Tree Nursery, a biscuit market, and a matryoshka workshop.

The Christmas Wish Tracker virtually sends your wishes to Santa's Post Office in the Santa Claus Village in Rovaniemi, Finland. You can pay a virtual visit to the Santa Claus Village for yourself using Google Maps Street View. Google Maps actually has  Street View imagery from inside Santa's Post Office (which receives up to 32,000 letters from children around the world every day).

пятница, декабря 17, 2021

Vaccine Rollouts by Country

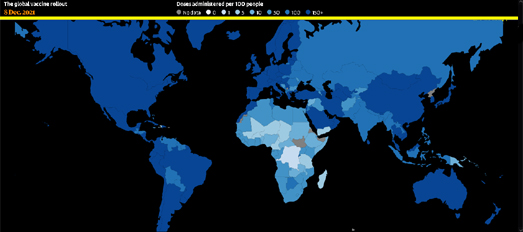
The Guardian has mapped out the rollout of the Covid vaccine around the world to explore which countries have vaccinated faster and why some countries have been able to vaccinate their populations much faster than others. Which countries rolled out vaccines faster – and why includes two maps which visualize the rollout of vaccines around the globe.

The first map in The Guardian article uses data from Our World in Data to show the rate of the vaccine rollout in countries around the world over the last year. It shows the number of vaccine doses administered per 100 people over time. The second map in the article quickly tweens into a graph which plots country GDP against the number of people vaccinated in a country. This graph shows that  there is a clear correlation between a country's wealth and the rate and scope with which a country was able to rollout vaccinations. 

Wealthy countries, such as the UK and the USA, have in general managed to rollout vaccines more quickly and to more people than poorer countries. The Guardian suggests however that wealth is not the only factor in the speed and expanse of vaccine rollouts. Supply issues have also been a factor in vaccine rollouts. Some wealthier countries may have been able to afford to rollout nationwide vaccine programmes early on but were hampered by limited supplies. 

Over time supply issues have become less extreme and as a result some countries in the Asia-Pacific region have overtaken some European and North American countries in the percentage of the population vaccinated. However, as you can see from the map above, many countries in Africa still have very low levels of their populations vaccinated. This could be dangerous for the whole world. If some countries are left vulnerable to large Covid-19 outbreaks then new variants are more likely to develop. It is therefore clear that wealthier countries around the world have to do more in supporting poorer African countries both economically and through the supply of vaccines.

четверг, декабря 16, 2021

Searching for the Big Bang

The James Webb Space Telescope's launch date is currently set for the 22nd December. The telescope's destination is the second Lagrange point, some 930,000 miles from Earth, directly opposite to the Sun. When in position the space telescope will be able to see into the furthest reaches of space up to13.8 billion light-years away. It will be able to detect light from the oldest stars and galaxies in the universe.

You can learn more about the James Webb Space Telescope (JWST), how it works and what it might detect in the LA Times' Finding the Big Bang. In this impressive scrollytelling visualization the Times not only explains the JWST's mission but uses 3D modelling to show where the telescope will be positioned. As you scroll through the article a 3D map of the Solar System reveals the location of the Hubble telescope and the Lagrange point (L2) from where the JWST will observe the universe's oldest stars.  

This model of the Solar System then rotates to show how the JWST's orbit will be synchronized to the Earth's orbit around the Sun, in order for the telescope to be able to maintain constant communication with the Earth. Towards the end of the article 3D models of the telescope and the Ariane rocket in which it will be travel to its L2 point show how the JWST will be launched and deployed into space. These animated 3D models also show how the JWST will unfold its sun shield in space in order to block light and heat from the Sun and protect the telescope from radiation.

The JWST should begin to send data back to Earth six months after its deployment. It will be operational for up to ten years. The telescope needs fuel in order to maintain its orbit. The JWST therefore does have an upper limit to its operational life.

среда, декабря 15, 2021

Mapping Future Construction Plans

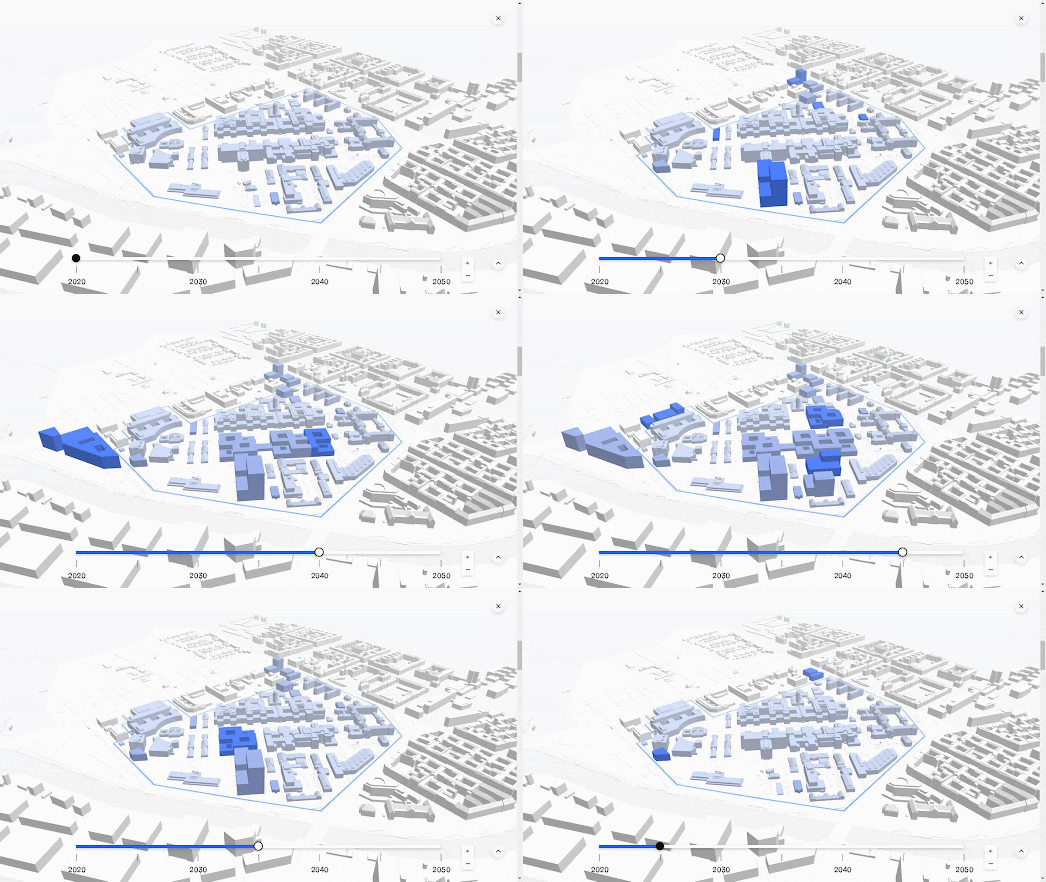
The Charité university hospital in Berlin has ambitious expansion plans. Over the next few years, under its 'Rethinking Health' strategy, the hospital plans to develop its four campuses in order to further support health care in Berlin and to provide the hospital with cutting edge research facilities. These construction plans for the hospital can be viewed on an impressive new interactive map.

The interactive map in Building the future. The new Charité includes four map insets, showing the building footprints of each of the hospital's four Berlin campuses. The map also includes a timeline control which allows you to view how each campus will be developed over the next thirty years. Move the timeline forward and blue building outlines are added to the map to show where the hospital plans to erect new buildings. 

If you click on one of the four inset maps you can view the chosen campus in full-screen mode. In this full-screen mode you can click on any of the blue 3D building outlines to learn more about that individual construction plan. It is also possible to rotate the map and to change the map's pitch by clicking and dragging on the 3D map.

The hospital was able to visualize its Rethinking Health vision with the help of the location intelligence company Ubilabs. You can learn more about how Ubilabs used three.js and WebGL to turn the hospital's architectural plans into a fully interactive 3D map on their blog post, Interactive 3D architecture models bring Charité's building plans to life.

вторник, декабря 14, 2021

Mapping Climate Change Conflicts

The non-profit CrisisGroup has mapped out where and how climate change is already  leading to diplomatic and military conflicts around the world. As the planet warms issues like water scarcity and the economic insecurity resulting from climatic volatility are heightening existing tensions between different regions and countries.

In How Climate Change Fuels Deadly Conflict CrisisGroup has mapped the risk factors of future conflicts arising from dwindling resources. Using the MapBox storymap template CrisisGroup also takes a close look at where climate change and global heating are already exacerbating existing tensions between countries. Concentrating on Africa the map examines a number of conflicts which are now being heightened as a result of climate change.

Many countries in Africa are already experiencing climatic distress resulting in resource competition and the displacement of people. These issues are in turn leading to conflict and heightened security risks. For example in South Sudan three consecutive years of extreme flooding has led to food and economic scarcity and the displacement of over half a million people. Elsewhere the Grand Ethiopian Renaissance Dam has led to diplomatic conflicts between Ethiopia, Egypt and Sudan. As climate change worsens and downstream Nile water supplies are threatened these conflicts have the possibility of escalating into more serious disputes.

You can read more about CrisisGroup's work on how climate change could fuel conflict around the globe on the groups' Climate Change and Conflict page. This includes the group's suggestions as to "how policymakers might best influence and respond to these complex changes to mitigate conflict risks".

понедельник, декабря 13, 2021

Mapping 100 Years of Tornado Data

The Tornado Archive is an interactive map which visualizes over 100 years of tornado data. The map uses historical weather data from a number of different sources, including the Storm Prediction Center, StormTrack and the National Weather Service.

The Tornado Archive interactive map includes a useful filter tool which allows you to explore the historical tornado data using a number of different variables. These include path length, path width, fatalities, injuries or state. You can use these filters to create very detailed searches. For example, visualizing all tornadoes over 50 miles in path length in Kentucky.It is possible to refine a search even further by using the 'Temporal' search tool. This tool allows you to refine the tornado tracks shown on the map by a date or date-range. 

The tornado tracks shown on the map are colored by their rating on the Fujita Scale. If you click on an individual tornado track on the map you can view details on that tornado's date, location, strength, and the number of casualties and fatalities (if any).


You can also view historical tornado data on the Tornado Tracks Tool interactive map from the Midwestern Regional Climate Center. This map visualizes the path of every tornado in the United States since the middle of the Twentieth Century, using data from the National Weather Service Storm Prediction Service.

You can filter the tornadoes shown on this map by scale, by year range and by the number of casualties caused. You can also select an individual tornado track on the map to view its strength, date, length & width and the number of injuries & fatalities.

суббота, декабря 11, 2021

Movie Maps

Earlier this week Vulture published an interactive map of over 50 New York locations which have featured as iconic movie locations. An Interactive Map of NYC Filming Locations features locations across New York City which have featured in films such as The Godfather, King Kong, You've Got Mail and John Wick. 

The map is a Google My Map so it doesn't include any fancy features - such as being able to search the map by movie name. To navigate the map you just need to click on one of the numbered New York locations to discover which famous movies have been shot there. The Vulture article accompanying the map includes more information about the 62 locations starring on the map and the movies in which these locations have featured.

In California the San Francisco Film Commission maintains a database of all the filming locations of movies shot in the city since 1924. Anyone can create an interactive map from the Film Locations in San Francisco data (DataSF). 

ABC7 News published their San Francisco Film Locations map earlier this year so it is fairly up-to-date. This interactive map includes the locations of some of the most famous films shot in San Francisco, including the amazing car chases from Bullitt, and Hitchcock's Vertigo. Unfortunately this map also doesn't include a search option so you can't easily discover which locations were used in specific films. However you can use the map to zoom in on your favorite San Francisco locations in order to discover which movies were shot near by. 

You can discover more filming location interactive maps using the Maps Mania moviemaps tag.

пятница, декабря 10, 2021

Civilian Casualties in Gaza

Airwars is an interactive map which documents where civilians were killed in Israel and Palestine during the May 2021 war in Gaza. From the 6th to the 21st of May this year the ongoing Israeli–Palestinian conflict erupted into violence, with both sides launching airstrikes. On 21st May a ceasefire brought to an end the use of airstrikes by both sides.

In May somewhere between 151 and 192 civilians were killed by Israeli military actions in Gaza. 10 civilians were also killed in Israel by rockets fired by Palestinian militants. Airwars has analyzed every Israeli and Palestinian airstrike launched during the 11 day war in order to assess and verify claims of civilian non-combatant casualties resulting from these missile attacks. 

The interactive map of the civilian casualties in Gaza uses height and color to visualize the number of deaths resulting from Israeli airstrikes in each Palestinian neighborhood. If you select a neighborhood on the map you can view data on the number of airstrikes which fell on the area during the conflict and the number of civilians who were injured and killed by the Israeli attacks. The map sidebar also shows photographs of the damage caused by these airstrikes and, where available, photographs of the civilian casualties.

The link at the top of this post is to the Airwars map of civilian casualties in Gaza. There is also an Airways interactive map of the 10 Civilian Casualties from Palestinian Military Action in Israel

In order to create both maps Airwars has compiled a comprehensive database of civilian deaths. The map and database are available in English, Arabic and Hebrew. The data includes geographical information of the civilian deaths, photographic & documentary evidence, and related military reports.

среда, декабря 08, 2021

Destroying the Rainforests

The Reuters news agency has created a number of very powerful visualizations showing the rate at which rainforests are currently being destroyed around the world. In Vanishing Tropical Rainforests Reuters show where and at what rate we are chopping down the world's largest living store of greenhouse gas. Effectively removing our very last chance of avoiding catastrophic global climate change.

Every two minutes 135,042 meters of rainforest are chopped down. Comprehending large numbers can be very difficult so Reuters uses an image of a rainforest to help convey the scale of this destruction. As you scroll through Vanishing Tropical Rainforests an image of a rainforest updates to show the level of destruction carried out every four seconds. This creates an effective visualization of the size of the 135,042 meters being removed form the planet every two minutes.

Reuters also uses a number of map comparisons to help explain the scale of deforestation currently taking place across the world. One map overlays the outline of New York over a satellite image of a rain forest to show the scale of rainforest removed every day (97 square km). An outline of Greater London is used to help show the scale of the amount of rainforest destroyed every week (683 sq km). The outline of the entire country of Belgium is used to show how much rainforest was cut down in 2019 (683 sq km). 

Later in the article Reuters uses a number of scaled squares to show the size of the rainforests in the Amazon, Central Africa, Borneo and Sumatra. Other embedded squares are then used to show the percentage of each of these forests which have been destroyed in the last 18 years and the percentage of these forests which have been degraded over the same period. Since the 1950s over 89% of the rainforests in Borneo and Sumatra have been destroyed or degraded. 

The South American rainforests represent the largest tropical rainforests still remaining. Brazil has the largest area of tropical rainforest. It is also the country where the most rainforest is currently being destroyed.

вторник, декабря 07, 2021

Taking an Earth Selfie

Planet currently operates over 150 active satellites. Every day these satellites capture imagery of the whole of planet Earth. The satellite imagery captured by Planet provide a daily picture of Earth and are therefore ideal for monitoring global changes and trends. Planet's Dove satellites are able to create a complete image of the Earth once per day at 3-5 m optical resolution. The satellites do this using a technique called a line scan. You can see how this line scan technique works on Planet's fantastic 3D globe visualization.

Our Constellation is a great visualization of how Planet Labs' satellites build-up their daily picture of the Earth. The satellites are displayed on the globe as white dots circling the Earth. As the satellites circle the Earth they capture imagery of the planet below. As the Planet visualization plays out you can see these individual satellite images being added to the 3D globe, showing how Planet Labs' network of 150 satellites creates its complete daily Earth selfie. The satellite images used in the visualization were all captured on January 25th, 2018.

Dove satellites are very small. They are about the size of an average shoe box.  Planet's Our Constellation website includes visualizations of how the Dove constellation provides global satellite coverage of the Earth. It also includes example satellite imagery captured by the Dove constellation of satellites and from Planet's other satellites. 

Maps Mania also featured the 3D globe above in 2019 when it was first created by Nadieh Bremer and was featured on her GitHub page. I was reminded of Nadieh's fantastic visualization by a Tweet from Alasdair Rae, which featured the nice animated GIF (above) of Planet's daily satellite scan of the Earth, and also included a link to the globe's new home on Planet's Our Constellation website.

суббота, декабря 04, 2021

The Refugee Map

The Wiener Holocaust Library in London has released a new interactive map highlighting the stories of refugees escaping antisemitism and persecution in Europe. The map uses historical records, including photographs, identity papers and diaries, to help reveal the journeys of refugees forced to flee their homes because of Nazi persecution and antisemitism in the years before, during and after the Second World War. 

The Refugee Map includes the harrowing stories of hundreds of refugees who were forced from their homes by the rise of fascism in the 20th Century. If you select a marker on the map you can read the personal stories of individual refugees. These accounts are often accompanied by video interviews, family photographs, diary entries or copies of personal documents. 

The 'Overlay' section of the map also includes the option to overlay a number of routes taken by individual refugees while attempting to evade capture by the Nazis. One of these routes shows the journey taken by Alfred Wiener - the founder of the Wiener Holocaust Library. 

Alfred and his family fled Berlin for Amsterdam in 1933. Then in 1938, after the events of Kristallnacht, Alfred moved to London. His wife and three daughters were to follow Alfred to London but became trapped in Holland due to the German invasion in May 1940. During his journey Alfred Weiner did manage to move the Library of the Jewish Central Information Office from Amsterdam to London. 

During World War II, the organization became known as Dr Wiener’s Library. The Wiener Holocaust Library is now Britain’s leading center of Holocaust and Genocide studies and has one of the world's largest collections of material relating to the Nazi era. 

You can listen to audio recordings made by Jewish survivors of the Holocaust on the British Library's Jewish Survivors of the Holocaust.

If you want to learn more about the history of the Nazi persecution of Jews in European cities then you might also be interested in:

  • Jewish Warsaw - a mapped account of the Jewish ghetto in Warsaw
  • Walk Among Memories - a virtual tour of the Riga Ghetto by the Riga Ghetto and Holocaust in Latvia Museum (unfortunately because of Google's extortionate map fees this map is now plastered with ugly error messages)

пятница, декабря 03, 2021

The 30 Day Map Challenge Round-Up

This year over 9,000 maps were posted on Twitter under the #30DayMapChallenge tag. The 2021 30DayMapChallenge came to an end with the end of November. This year maps were posted in 32 different languages from countries all over the world. 

You can view a huge map wall featuring screenshots of all 9,036 maps posted to Twitter this November on the 30DayMapChallenge-Bot GitHub repository. The 30DayMapChallenge-Bot repository also features: a bar chart (showing the number of maps submitted for each day of the challenge), data on the most favorited Tweets for each daily challenge, and a map showing the locations around the world where people submitted maps from.


The 2020 30 Day Map Challenge Map Gallery

If you are interested in viewing the maps submitted as part of last year's 30 Day Map Challenge then you can refer to the 2020 Map Gallery. David Friggens' map gallery allows you to explore last year's maps by the day submitted, by type of map and by the tools used to create each map.

The 30DayMapChallenge also now has its very own official website. The website features the official categories for each day's challenge in 2021. It also features a very useful resources guide with links to handy data resources and map creation tools which can be used for creating maps. The 30DayMapChallenge website also has a number of links to map tutorials and to other collections people have curated from maps submitted to the 30DayMapChallenge.

четверг, декабря 02, 2021

Speaking French in Canada

In 1504 the first French fishing ship arrived in Newfoundland, where it discovered seas very rich in fish. In the next 30 years more and more French fishing ships ventured across the Atlantic and some even set up temporary settlements to dry cod, especially on the coasts of Newfoundland and Cape Breton Island. These fishermen were among the first ever French speakers in Canada.

French is now the mother tongue of around 20% of Canadians. It is, with English, one of the two official languages of the country. You can learn more about how the French language arrived and spread in Canada on the interactive map Voyages en Francophonie Canadienne. The map provides a chronological history of the establishment and spread of the French language in Canada from the 16th Century until the present day. 

A timeline runs along the bottom of the map which allows you to explore the historical entries by date. Follow the timeline and you can learn more about the first French colonies established in Canada and the explorations of the country made by French catholic missionaries. The map also explains a little about the establishment of French colonies elsewhere on the continent, for example in New Orleans and elsewhere in Louisiana. 

If you select the period '2000...' you can learn more about the present state of the French language in Canada and its future in the country. This includes sections on what is being done to support the immigration of French speakers, the health of Francophone schools and the efforts to ensure the French language continues to be supported by all Canadian institutions.


You can discover more about the current mother tongues spoken in Canadian homes on the interactive dot map Langues Maternelles 2016. On this map Canadian company Anagraph has plotted the languages spoken by all 34,504,810 Canadians. On the Langues Maternelles 2016 dot map you can see the mother tongue languages spoken in every neighborhood in Canada, according to the 2016 census.

The map reveals how in most Canadian cities people with the same languages often live in the same neighborhoods. For example in Montreal French speakers dominate in the northern districts. English speakers tend to live in southern and south-eastern neighborhoods. Chinese speakers can mostly be found in Brossard and there appears to be a fair number of Italian speakers in north-eastern Montreal.

You can find out the proportion and numbers of Canadians who speak French and English on the Canadian census website. In Update of the 2016 Census Language Data you can view a table showing the percentage of mother tongue speakers of French and English and the total number of the population who speak the two languages. In 2016 there were 19,460,855 people with English as their mother tongue, 7,166,700 with French as their mother tongue and 7,321,060 whose mother tongue was neither French nor English. 

среда, декабря 01, 2021

Weather Stripes

Ed Hawkins' clever Climate Stripes visualizations of global heating over time have quickly become a data visualization design classic. In 2018 Ed Hawkins, a climate scientist at the National Centre for Atmospheric Science at the University of Reading, released this new form of data visualization to illustrate how temperatures have risen around the globe over the last century. 

Ed's Climate Stripes visualizations use colored stripes to show the average annual temperatures for every year over the course of a whole century. The result is a very powerful and clear visualization of how temperatures have begun to rise very quickly over the last few years when compared to previous norms.

Weather Spark may well have been influenced by Ed Hawkins' Climate Stripes in their development of city weather plots. You can view the Weather Spark weather plot for your city (and for other cities around the globe) on The Weather Year Round Anywhere on Earth

Like climate stripes these weather plots use the x-axis to show temperature over time - although in this case there are 12 rather than 100 data points to show average temperatures for each month rather than for each year in one century. Weather plots also differ from climate stripes through the addition of a y-axis. The y-axis on Weather Spark's weather plots show average temperature throughout the course of one day (24 hours). Weather Plots can therefore be used to view the average temperatures in a city during the course of a day in any month of the year. 

Weather Plots are particularly good for comparing the average temperatures of different cities. For example the weather plots for London and San Francisco reveal that both cities share a similar mild climate. San Francisco's season of 'comfortable' weather (shown in yellow) lasts for a few more months than the 'comfortable' season in London. However 'comfortable' temperatures in London tend to last longer during the day, resulting in London having warmer summer evenings than those experienced in San Francisco. 


Toronto actually experiences higher average temperatures during the height of summer than both San Francisco and London. However Toronto is much colder in the winter. It experiences 'freezing' temperatures during the winter months, while San Francisco and London both enjoy relatively mild winters.


You can use the Weather Spark interactive map to view the weather plots for other cities around the world. The map also provides an interesting overview of the average monthly and hourly temperatures which can be experienced at different latitude and longitudes around the world. 

вторник, ноября 30, 2021

Violent Conflicts in the Republic of Texas


In the early 19th Century Texas was one of the most diverse regions in the North American continent. It was home to a number of Native American tribes. It was also home to a large Mexican population and a growing number of illegal immigrants from the United States.

After the formation of the independent Republic of Texas in 1836 relations between Native Americans and Euro-Americans was often strained. The nationalist faction in the new republic led by Mirabeau B. Lamar, advocated for the expulsion of all Native Americans from Texas. Conversely some of the Native American tribes, such as the Comanches, opposed the new republic.

The University of Texas' Border Lands interactive map is an attempt to document and map the locations of the many incidents of conflict between Native Americans and Euro-Americans in Texas during the period from the creation of the First Mexican Republic to the outbreak of the U.S.-Mexico War (1821-1846). 

The interactive Border Lands map includes three main views. The Timeline view allows you to explore all the mapped sites of conflict by date. This timeline view includes a date control which allows you to filter the incidents shown on the map by date range. It also includes an animation view which adds all the sites of conflict to the map in chronological order. The Heat Map view provides a a visualization of the density of conflicts by location. This view provides an overview of which locations in Texas witnessed the most violent conflicts during the period 1821-1846. The Fatalities map view uses colored markers to visualize all the violent conflicts between Native Americans and Euro-Americans by the resulting number of deaths. 

You can gain a deeper insight into the indigenous tribes which were native to the area now known as Texas on the Native Land interactive map. Native Land is an interactive map attempting to show the locations of indigenous territories, languages and treaties around the world.If you zoom in on Texas on the Native Land map you can explore which Native American tribes and languages were indigenous to the area before the arrival of Europeans.

понедельник, ноября 29, 2021

Mapping for Christmas

A necklace, earring, ring or brooch from Talia Sari's You Are Here jewelry range would make the perfect Christmas present for any cartophile in your life.Each item of You Are Here jewelry is custom made based on your chosen location. Just enter a location into the Mapbox powered wizard and Talia Sari can make you a custom item of jewlery using the street map of your favorite location.

Prices start at around $149 for a map necklace, ring or brooch and $171 for a pair of earrings.

If you have been wondering what to buy me for Christmas then might I suggest a 3D mini city model of London. MiniCityArt make 3D models of major global cities. Each model is 3D printed on an FDM 3D printer using biodegradable plastic. The models range in size from 8" to 54". Custom city models can also be made on request.

Prices start from $119.

The present of choice for every fashion conscious cartophile this Christmas is a wearable map. Splash Maps make wearable custom maps printed on weatherproof fabrics. The products available in the Splash Maps store include map face masks, scarfs, tablecloths and even shower curtains. Each Splash Maps product can be made from the map location of your choice.

A polyester-cotton London map face mask can be currently bought for just £3.25.

Of course if you are really struggling for Christmas present ideas then you can't go wrong with a printed map. Mapiful create beautiful map posters for any location on Earth. Using Mapiful's interactive map wizard you can select any location in the world, select whether you want a landscape or portrait orientated poster, choose a map size, and even change the map headings. The Mapiful creation tools also includes a number of different map style themes from which to choose.

Prices start from around $40.

суббота, ноября 27, 2021

Sea View


Put on your virtual life-jacket. This weekend we are going kayaking around Puget Sound, exploring the marine waterways and basins of this Pacific Ocean inlet. There is no need to worry about the cold weather either, because you can now explore this beautiful stretch of water through the power of interactive panoramic Sea View.

The Puget Sound Nearshore Mapping Campaign has been busy capturing 360 degree panoramic imagery of the Puget Sound nearshore by kayaking around the 1,200 miles of this north-western inlet of the Pacific Ocean. Using EarthView's new interactive map you can explore Sea View imagery of the Seattle waterfront, the Port of Tacoma, Fish Trap Cove and many other locations from around the sound. 

The beautiful panoramic imagery provided by EarthView is only one result of the Puget Sound Nearshore Mapping Campaign. EarthView is actually mapping Puget Sound by kayak in order to create more accurate maps of the sound nearshore. Maps which they hope can then play an important role in helping to recover and protect the critically important natural habitats of Puget Sound.

The kayak being used to capture this panoramic imagery of Puget Sound is also equipped with a water quality meter that has been used to record water conditions along the nearshore. The kayak has also been used to record animal sightings on the Puget Sound nearshore.

If you are feeling particularly adventurous then you might also consider taking a virtual dive beneath the waves. The Catlin Seaview Survey has been capturing underwater 360 degree panoramic imagery from across the world for a number of years. Their Virtual Dives website allows you to explore some of this submarine Street View imagery from the coast of Indonesia, among the coral reefs of American Samoa, from the Great Barrier Reef, the Galapagos and from many other beautiful undersea locations from around the globe.

пятница, ноября 26, 2021

LiDAR Data Reveals Illegal Logging

LiDAR data has been used to suggest that the logging company VicForests has been carrying out illegal logging in the state of Victoria, Australia. ABC News has obtained high resolution LiDAR data of Victoria's state forest which has allowed researchers to map the underlying terrain. Loggers in Victoria are prohibited from logging on hills which are steeper than 30 degrees. Thanks to the new LiDAR data it is now possible to reveal that between 2004-2019 VicForests illegally logged over 65 hectares from slopes exceeding 30 degrees.

The trees in the forests of Victoria play an integral role in filtering the drinking water of the city of Melbourne. As water flows down the mountains of north-east of Melbourne the roots of the forest trees slow the water's progress. When slowed the water seeps into the ground, where it is then naturally filtered by the soil. This is one reason why it is illegal to log trees on the steep mountain slopes in the water catchment area.

ABC News' Lawless Loggers uses 3D maps to explain how the newly obtained LiDAR data has been used to model the Victoria terrain and reveal where VicForests has been logging on slopes with a higher gradient than 30 degrees. Environmental researchers analyzed 332 logged areas in the state. 331 of those areas had a slope of at least 30 degrees. 

Sixty percent of Melbourne's drinking water comes from the catchment area being logged by VicForests. That water is delivered to the city's residents with very little filtration. VicForests deny that they are involved in a widespread breach of Victoria's slope limits. The Office of the Conservation Regulator (OCR) is responsible for enforcing the state's logging laws. It has twice found VicForests guilty of illegal logging but on both occasions declined to take any regulatory action against the logging company.

четверг, ноября 25, 2021

Navigating by Nose

We have all used our nose to navigate by. Like me I'm sure you have used your nose to find the nearest abattoir while taking the pigs to slaughter or in order to find your date's house next to the sewage plant. Which makes it rather odd than no-one has previously thought to use the nose as a way of navigating an interactive map.

The Earth-Nose Direction Game is a new fun map based game which requires you to navigate an interactive globe using your nose.Don't worry - you don't have to wipe your nose across your phone's touch-screen. This Earth-Nose Direction Game uses your device's video camera to read your head movements.

Once you agree to allow the Earth-Nose Direction Game to access your device's video camera a small circle will appear on the interactive globe. Your object is to navigate to that circle using head movements. Moving your head left or right is equivalent to swiping the globe right or left, while moving your head up or down navigates the globe down or up.

Each circle on the map contains a number of friends (the number of friends is determined by the city's population). If you manage to navigate to a circle those friends are added to your total and another circle is added to the map. 

I already have 15 million friends. I wonder how many you can get?

среда, ноября 24, 2021

The Geography of a Dollar Bill

Every dollar bill in the United States is issued by one of the 12 Federal Reserve Banks (FRB). These FRB's are located in Boston, Richmond, Minneapolis, New York City, Atlanta, Kansas City, Philadelphia, Chicago, Dallas, Cleveland, St. Louis and San Francisco. Every single one dollar bill carries a seal which identifies at which one of the twelve FRBs it was issued. 

Excerpt of a note, showing the seal.
 Seal of the Richmond Federal Reserve Bank

Using the seal of the issuing bank it is possible to determine where a $1 originates. It is therefore possible to map the geographical journey of a dollar bill. As people travel around the United States they carry money from state to state. In this way a single dollar bill can end up traveling a long way around the country. In February 1976 S. Pignatello took a sample of $1 dollar bills spent in MacDonalds outlets in each of the twelve Federal Reserve Board districts. Using the identifying seal of each dollar he was able to create an origin/destination matrix, showing how many notes issued in each district were discovered in each of the 11 other districts.

Visionscarto has used the origin/destination table created by S. Pignatello to create a flow map showing the movement of dollar bills around the United States. The flow map in Routing Dollars visualizes how dollar bills move between the 12 Federal Reserve Bank regions. The colored circles indicate whether an individual FRB region is a 'source' (prints more money than they use) or a 'sink' (uses more notes than they print). The orange colored FRBs on the map are sources and the blue FRBs are sinks.

You can track the journeys of individual dollar bills on Where's George?. If you enter the serial number of a dollar bill into Where's George? you can begin to track its journey around the United States. By entering a serial number of a dollar bill and then marking the bill with the www.wheresgeorge.com URL you can find out where the bill travels (if other people who end up owning the bill log on to Where's George to update the note's journey).

For example on Where's George you can view a map of one $1 dollar bill which has traveled over 13,905 Miles in just 7 years. During this journey it has been to France and back. It has also visited Texas, Arizona, New Mexico, Las Vegas, South Dakota, Florida, Ohio, New York and Virginia.

вторник, ноября 23, 2021

The North Sea is Very Busy

Delft University of Technology has worked with Microsoft to map the huge amount of marine traffic off the coast of the Netherlands. In Crowds on the North Sea TU Delft takes a detailed look at this new map of North Sea marine traffic. 

As you scroll through Crowds on the North Sea the map zooms and pans to highlight and explore the different  types of shipping traffic active off the coast of the Netherlands. This includes large ferries used for shipping passengers to and from the Netherlands. The map also reveals the main routes taken by the fleets of container ships constantly sailing in and out of the huge Dutch commercial ports. The AIS tracks of dredging ships can also be seen as they work to keep the main shipping routes open for all other shipping traffic.

Of course the North Sea isn't only used for marine traffic. The sea is also home to wind turbine farms, sand extraction sites, communication cables and gas pipelines. The Crowds on the North Sea interactive map also shows where these other key infrastructure assets are housed in the very busy  North Sea. There are also plans to locate storage facilities for CO2 and to build artificial islands for housing & for an airport - in this already crowded and very active area of the North Sea off the coast of the Netherlands.

The area of the North Sea off the Belgium coast is also one of the busiest seas in the world. In fact Belgian territorial waters are so busy that the North Sea off the Belgian coast sees more marine traffic than both the Panama Canal and the Suez Canal. 

To help illustrate the huge amount of marine activity which takes place off the coast of Belgium the financial newspaper De Tijd created an animated map which visualizes 24 hours of marine traffic, using data from marinetraffic. On this animated map different colors are used to show four distinct types of marine vessel. In the story The North Sea is Teeming container ships are shown in yellow, the blue vessels are fishing boats, dredgers are shown in red and other types of ship are shown in gray. 

The North Sea off the Belgian coast is very shallow and contains many sandbanks. As you progress through De Tijd's story the navigable sea routes off the Belgian coast are added to the map. Look out for the red boats on the map which show the dredgers constantly working to keep these sea routes navigable.Keep scrolling and the dredging dumps, where the dredgers tip the sand and silt cleared from the sea routes, are also added to the map.

As well as the animated map showing 24 hours of marine activity 'The North Sea is Teeming' includes maps which show the major wind farms off the Belgian coast, the location of protected nature zones in the North Sea, and the locations of gas, electricity & telecommunication pipes & cables. Towards the end of De Tijd's story another map is used to show that underwater noise pollution in the North Sea is loudest off the Belgian Coast. With all this marine activity it is easy to understand why.