четверг, июня 30, 2022

Mapping Vintage Newspapers

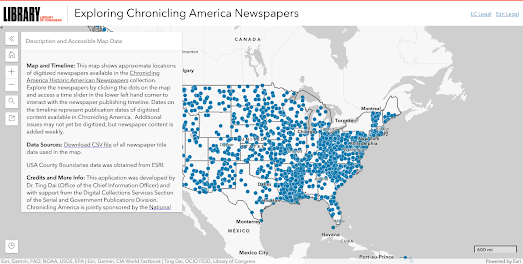
The Library of Congress' Chronicaling America project digitizes historic newspapers from across the United States. Using the site anyone can search and read historic newspaper stories published at any time from 1777-1963. A new interactive map now allows you to search these vintage newspapers by location.

The new Exploring Chronicaling America Newspapers interactive map allows you to browse the LOC's collection of digitized newspapers by the location of their publication. Each dot on the map represents a location with one or more digitized newspapers. Click on a dot on the map and you can learn more about the local newspapers at that location, including information on how many issues have been digitized. You can then click through to view the digitized editions of the selected newspaper.

The LOC map includes a timeline control which allows you to filter the newspapers shown on the map by date. 


You can also find and read historical newspaper articles using Ancestry's Newspapers.com. Ancestry's Newspaper.com claims to be the largest online archive of newspapers. The archive includes searchable articles from over 21,000 newspapers dating back to the 1700's (although there seems to be a distinct bias towards English language newspapers).

A similar service exists in the UK at the British Newspaper Archive, which allows you to search archived British newspapers for free but only allows registered users to read actual digitized content from the archived papers.

You can search and read through 129 years of New York Times' back editions on the newspaper's TimesMachine website (again a subscription is needed). Using the TimesMachine's interactive interface you can read the Time's contemporary accounts of historical events, including the shooting of President Lincoln, the sinking of the Titanic and the landing of the first men on the moon. 

Wikipedia also maintains a list of online newspaper archives. This list includes links to both free and paid archives of newspapers around the world. The Wikipedia introduction to its list includes the handy advice that your local library may have subscriptions to newspaper archives which you can access for free if you have a library card.

One other option is to explore the archives of still operating newspapers. The Newspaper Map provides direct links to thousands of newspapers currently operating all around the world.

среда, июня 29, 2022

Introducing Mapbox Globe View

Mapbox's 3D globe view is now available to all developers. The new globe map projection option in Mapbox GL and Mapbox mobile SDKs allows you to turn your 2D maps into fully interactive 3D globes. The new globe view includes a number of styling options which allow developers to "adjust the color of space, (the) visibility of stars, and the color of the atmosphere around a globe".

If you want an idea of what you can do with the new Mapbox globe view then have a look at the Twitter hashtag #mapboxglobe, which Mapbox has been using to share some of the globes that developers have already begun creating with this new projection option. These maps include Steve Attewell's Mapbox Globe from the ISS.

Sam Lerner's impressive River Runner map is also now available with a 3D globe view. Click anywhere in the world on the River Runner map and you can follow the journey that a raindrop might make from that location to the nearest ocean (based on the local terrain).


You can also use the globe view projection with vintage maps. I used an 1845 map from the David Rumsey Map Collection to create this vintage globe. This map overlays William Woodbridge's 'Moral And Political Chart Of the Inhabited World' on top of Mapbox's globe view. 


If you want to try this yourself you can clone my map on its Glitch page. You can then drop in any georeferenced map from the David Rumsey Map Collection.

вторник, июня 28, 2022

Game of Populations

The UK's Office for National Statistics (ONS) has today released the latest population and household estimates for England and Wales based on the 2021 census. The population of England & Wales is now 59,597,300. In the previous census (2011) the population of England & Wales was 56,075,912 The UK population as a whole is now almost 67 million.

In celebration of the new population data for England & Wales the ONS has released the Census 2021 Population Game. In this new daily game you have to travel across a map of Great Britain, step by step, until you reach the suggested destination. To move forward across the map you have to guess correctly at each stage whether the next local authority area has a higher or lower population than the local authority area that you are currently located on (on the map). 

Each time you get an answer wrong that local authority area is marked red. Turn too many local authorities red and you will end up blocking all the possible routes to your destination. In which case you lose the game. Winning the game is simple - you just need to reach the stated destination.

The Census 2021 Population Game has taken quite a lot of inspiration from Ahmad Barclay and Sam Cottrell's MapBusters game. MapBusters requires you to travel the length of Great Britain from Land's End to John O'Groats by guessing the population of local authority areas. This game, released last year is very, very similar to ONS's new game but used 2020 mid-year population estimates rather than the newly released England & Wales population data.

They Paved Paradise

USA Parking Lots is an interactive map of the United States which blacks out every single parking lot in the country. Of course because this is America it means that if you zoom in on a major city the map displays a lot of black polygons.

Because the map doesn't have a FAQ page I don't know how the data for the parking lots was obtained. If I was going to make a similar map for the UK I would probably use Overpass Turbo to retrieve the data from OpenStreetMap. 

America is very much still in love with the automobile and as a European it is always shocking to see how much urban space in the United States is devoted to the car.  This is perfectly illustrated by Better Institutions. Back in 2016 Better Institutions created an interactive map to visualize the 200 square miles of Los Angeles parking lots as one huge circle.


Los Angeles has around 200 square miles of parking spaces. This means that there is more space for each car in Los Angeles county than there is for each person. To help illustrate the amount of space given over to parking cars in LA Better Institutions lumped all these parking lots together to create one big imaginary parking space. This parking space is 16 miles in diameter.

You can see how much room all LA's parking spaces take up in Mapped: All 200 Square Miles of Parking in LA County, As One Giant Parking Lot. The actual interactive map itself no longer works but you can still see a screenshot of the map (shown above).

Unfortunately the USA Parking Lots map doesn't include any measurements detailing the amount of space dedicated to car parking spaces in individual American cities. If I had one feature request for this map it would be to show the total area of space in the current map view which is dedicated to car parking (possibly using turf.js to calculate the area inside all the parking lot polygons in the current map view) 

This Percent Built On map from Ordnance Survey has the kind of functionality I'm after. This OS map allows you to define an area by drawing on the map and then calculates the percentage of the selected area covered by buildings.  It would be great to have the same functionality on the USA Parking Lots map in order to show the percentage of the defined area that is covered by parking lots.

понедельник, июня 27, 2022

Explore the Pyramids of Meroë

Fresh from climbing Mount Everest in 3D today I'm undertaking a tour of the Pyramids of Meroë. If you travel south down the River Nile through Egypt to Sudan, just before you get to Khartoum you will come to Meroë, the ancient capital of the Kushite Kingdom. Here you will discover an ancient city which is home to more than 200 pyramids.

Google Arts and Culture's Pyramids of Meroë is a fascinating virtual tour of the Nubian pyramids located in the Sudanese desert. The Pyramids of Meroë were constructed in the Kingdom of Kush during the Meroitic period (542 BC–4th century AD).

As you scroll through the Pyramids of Meroë you are taken on a virtual tour of a 3D model of the pyramid of King Arkamani the First. This tour explains how these distinctly steep sided structures were built over 2,500 years ago. Keep scrolling and you can dive inside the pyramid, explore the hieroglyphs on the Offering Chapel's walls and view a 3D illustration of the pyramid's underground tomb.

After exploring this 3D model of King Arkamani the First's pyramid you can explore Meroë for yourself  using Google Maps Street View. This Street View tour includes interactive panoramic images of the partially buried pyramid of King Kalka Kaltaly, the pyramid of Queen Amanitore and the pyramid of King Adeqetali.

GoeGuessr for Art

Geo Artwork is a fun game in which you have to guess where individual works of art were created. The game is very similar to the popular Geoguessr game, except instead of trying to work out the location of Google Maps Street View images you have to work out the origins of individual works of art.

In Geo Artwork you are shown a painting (or another type of artwork) and using your knowledge of art history and global art you have to guess where the artwork was created. To do this you just need to point to the location on the Geo Artwork map. You are then awarded points based on how close you guessed to the correct location.

If you need a little help with a painting you can click on the 'Learn More' button. This will reveal the artwork's entry on Google Arts and Culture, which includes information on the title of the artwork, the name of the artist and the museum or gallery where it is exhibited.

суббота, июня 25, 2022

Where is Abortion Illegal?

Following Friday's decision by the Supreme Court to overturn Roe vs Wade the legality of abortion has now been handed over to individual states. This means that a woman's right to choose in the United States depends on a patchwork of laws which range from states with outright bans on abortion to states where the right to choose is enshrined in law.

To help inform women of their local laws Planned Parenthood has created an interactive map which explains the current abortion laws in each state. Where is Abortion Illegal? colors each U.S. state based on the legality of abortion. As you can see from the screenshot of the map above many states have already banned most abortions (states colored black).

You can also find out more about the legality of abortion in individual states on the Guttmacher Institute's interactive map Lay of the Land. If you click on a state on either the Planned Parenthood or Guttmacher Institute maps you can view details of the state's current abortion policies. Both maps have color-coded states using seven different categories from those with the most restrictive abortion rights to those with the most protective abortion rights.

If you want to protest against the overturning of a 49 year constitutional right to an abortion then you can refer to Women's March's interactive map of protests against the Supreme Court ruling. We Won't Go Back shows the location of protests and days of action across the United States.

If you select a marker on this map the details of the protest will be displayed in the map side-panel. You can filter the protests shown on the map by date and by type of event. The map can also be searched by city or zip-code.

пятница, июня 24, 2022

Climb Mount Everest in 3D

Mount Everest 3D is an impressive 3D map of the world's tallest mountain and the peaks which surround it in the Himalyayas. The map uses high resolution aerial imagery draped over a 3D digital elevation model to provide a unique view of one of the world's most beautiful and inspiring landscapes.

As wall as being able to pan around and zoom in on the wonders of the Mahalangur Himal sub-range of the Himalayas the Mount Everest 3D map includes overlays showing the two most-travelled routes to the peak of Everest. These route overlays include waypoints showing the locations of camps along the route, and photographs of the Himalayan scenery.

You can get an even closer view of the Everest region of the Himalayas with Google Maps Street View. 

To capture 360 degree panoramic imagery in the Himalayas Google teamed up with Apa Sherpa (a Sherpa mountaineer who holds the world record for reaching the summit of Mount Everest 21 times) and the Nepalese nonprofit organization Story Cycle. During a 10-day trek through the Khumbu region with Apa Sherpa Google managed to capture Street Views of mountain trails and a number of Sherpa villages. The best way to explore this Street View imagery is to visit the Khumba map on Google Treks.

The Khumba site on Google Treks includes some lovely hand-drawn maps of the featured villages. Each of the maps include map markers which lead to Street Views captured on Google's 10-day trek. These include Street View imagery of monasteries, temples, trekker's lodges and of course some wonderful mountainous scenery.

четверг, июня 23, 2022

A Brief History of Time & Space


the shifting borders of the Holy Roman Empire from 1000-1750

Point in History is an interactive map which allows you to explore country and regional borders over time. The map uses historical boundaries data from the Historical Boundaries Project in order to show how the boundaries of countries around the world have developed and changed through history.

If you click anywhere on the map a timeline will be added to the map sidebar. You can then select individual years from this timeline to view the selected country's borders at that point in history. For example the animated GIF above shows the changing borders of the Holy Roman Empire between 1000 and 1750.

Historic Borders is another interactive map which uses the Historical Bounderies Project's data to show changing country borders over 4,000 years of history (2000 BC-1994). Using the Historic Borders' interactive timeline you can view a map of the world at any specific period within this 4,000 years of history.

The main difference between Point in History and Historic Borders is that the later map provides a global view of country borders for the chosen date, whereas Point in History concentrates on just visualizing the borders for your selected location.

A number of other maps also look at how the world map has changed as political boundaries have changed through time. Links to some of these historical border maps can be found in the Maps Mania post Mapping History.

The Drunken Spider Crawl

Today I finally got around to creating my own 'data spider' map, inspired by William Davis's viral Hub and Spoke interactive map.

My Drunken Spider Map can help you find the ten nearest bars to any location in London or New York. If you pan around the map then the 'spider' will walk around the map, so that it is always pointing to the ten nearest bars to the center of the map.

Cloning William's map was very easy. Essentially all it involved was adding my own data and Mapbox account code. I also added a geolocate button. So, if you live in London or New York you can simply press this button to automatically find the ten nearest bars to your current location.

My Drunken Spider Map is hosted on Glitch, which means you can easily clone the map simply by pressing the 'Remix' button on its Glitch page. If you want to create a Drunken Spider Map for your town or city then you can use overpass turbo to quickly get the data for all the local bars.

If you want bar data for a different city then you can use this overpass turbo query. Simply center overpass turbo on a city, press the 'run' button' and then press 'export' and save the data as a geojson file. Then add the data to your Glitch clone of my Drunken Spider Map.

Of course you could always use overpass turbo to download other data. For example this query will give you the locations of all the cafes in the current map view on overpass turbo. Of course if you do use cafe data then you should change the name of your project from the Drunken Spider Map to the Caffinated Spider Map.

среда, июня 22, 2022

Brooklyn Bridge is Falling Down

Brooklyn Bridge may not be about to fall down any time soon, however according to the U.S. National Bridge Inventory Map it is in 'poor condition'. Esri's U.S. National Bridge Inventory Map uses government data to map the age and condition of bridges over 100 years old in the United States. The map can be used to discover the condition of bridges across the country and view data on how much traffic they carry.

If you click on Brooklyn Bridge on Esri's map an information window informs you that the, "bridge was built in 1839, making it 139 years old. It's in poor condition and has 116,071 average daily crossings". The Brooklyn Bridge isn't the oldest bridge on the map. The oldest still functioning bridge is Pennypack Creek Bridge, Pennsylvania, which was built in 1697. The Pennypack Creek Bridge is described as being in good condition and still has 12,200 average daily crossings.

The U.S. National Bridge Inventory Map includes a number of filtering options. If you want to avoid any bridges that may be in danger of collapsing then you can filter the map to show only those bridges the government has decreed as being in poor condition. There are 4,121 of these - carrying on average of nearly 129 million daily traffic. Other options allow you to filter the bridges by age and by average daily traffic.

вторник, июня 21, 2022

100 Years of Climate Data


The European Climate Assessment & Dataset project records data for more than 15,000 weather stations across Europe. This data includes historical temperature and precipitation records dating back as far as the 19th Century. The data provides comprehensive evidence of how climate change has contributed to extreme rises in temperature across the whole of Europe.

The Climate ECAD Map uses this ECAD historical weather data to map the extent of this climate change at locations across Europe. On the map individual weather stations are colored to show how temperatures have changed over time. You can hover over individual stations to learn exactly how many degrees the temperature has risen at that location above the historical mean. 

You can select individual weather stations on the map to explore the historical temperature and precipitation data for that location in more detail. Click on a station on the map and you can view radial charts visualizing mean temperatures and precipitation totals for all twelve months of the year. If you hover over the radial chart you can view the difference between the 2022 records for each day and the historical mean. 

The graph above each radial chart plots the mean temperature or total precipitation for each year for which there are records at the selected weather station. If you select a year on this line graph the radial chart will show every day's weather record for that year plotted against the historical average. On the chart increases above the historical average are colored red and temperatures below the average are colored blue. So, for example, on the screenshot above you can see how temperatures in Vienna last year were far above the historical average for nearly the whole year. Only for a few days in April and May of last year did Vienna record temperatures which fell below the average historical temperature for the time of year.

понедельник, июня 20, 2022

Mapping the French Election

Macron's En Marche! party has failed to win a majority in France's new National Assembly following strong performances by the left-wing alliance and the far right. The president's En Marche! won the most seats of any party in the national election. However the 245 seats won by Macron fall well short of the 289 seats needed for an overall majority in the National Assembly and far short of the 350 seats won by En Marche! and MoDem in 2017. 

Le Parisien's Five Maps to Understand the Surprising Second Round does a good job of visualizing the support for the major parties across France. Le Parisien says that the political map of France is now difficult to read and that the only geographical pattern to emerge in this year's election was the strong support for the far-right RN party in "the North, the East, the Mediterranean rim, and, more surprisingly, in New Aquitaine".

Marine Le Pen's far-right National Rally party turned the 8 seats won in 2017 into 89. This means that an extreme far-right party now has a significant presence in the National Assembly. In fact RN are now the second largest party in the Assembly. Nupes, the coalition of mainstream left-wing parties with the Communists and Greens, may have won 131 seats between them but it remains a fragile coalition which may struggle to maintain a united front in opposition. And no one party in this coalition has as many seats on their own as the extreme right-wing National Rally. 

Liberation's Results of the second round of the 2022 legislative elections includes a cartogram map of the results. This cartogram colors each department by the candidate who received the most votes and scaled by the size of the population.If you click on the 'territoire' button on this cartogram you can view a more traditional map view of the results. 

If you select a political party from the list above the map you can view just the seats won by that political party. If you select Nupes you can see by the large clusters of dots on the cartogram how the left-wing coalition performed particularly well in some of France's largest cities. Conversely if you select RN you can see how the extreme far-right party, despite its success in the North-East of France has yet to make much of an impact in Paris. 

Le Monde has also released an interactive map of the National Assembly election results. On Le Monde's map each constituency is colored to show the party of the winning Deputy. If you click on an individual constituency on the map you can view the number of actual votes won by the two candidates in the 2022 National Assembly election.

суббота, июня 18, 2022

Backup Ukraine

According to Ukraine's Ministry of Culture Russia has already destroyed over 300 buildings and sites of cultural importance in Ukraine. This includes the total destruction of 9 cultural heritage sites in the Donetsk, Kyiv, Sumy and Chernihiv regions. 

In response to this destruction of Ukraine's cultural and historical heritage the Backup Ukraine project is helping volunteers to capture and create 3D models of important cultural artifacts & buildings before they are destroyed by Russian missiles. Simply by using the popular Polycam app on a mobile phone anybody can scan a building or monument and upload the resulting 3D model to the Backup Ukraine website. 


3D model of a statue in Lutsk

You can explore the 3D models already uploaded to Backup Ukraine on a handy interactive map. Click on a model's location on this map and you can view the 3D model directly in your browser. Each model includes a share button which enables anyone to embed the model on their own website or blog (as I've done with the statue above).

As well as capturing 3D scans of important cultural & historical artifacts & buildings Ukrainians have been using the app to capture 3D models of more personal items, such as children's toys and family pets. The app has also been used to document destroyed tanks and vehicles.

You can also explore some of the terrible destruction inflicted by the invading Russian army through the incredible 3D models created by Hidenori Watanave on his Satellite Images of Ukraine and 3D Data & 360 Panoramas Map of Ukraine.

These maps use data from images and videos captured in Ukraine to recreate incredible 3D models of some of the devastation caused by the Russian army. 3D photogrammetric models have been created of buildings and vehicles which have been destroyed during the war using drone captured imagery and photos taken on the ground. The result is two shocking interactive 3D maps which allow you to view some of the devastating destruction in Ukraine from an almost first person perspective. 

The official website of the Department of Tourism of the Kyiv Oblast State Administration are also determined to record and document the destruction being caused in their region. In order that no-one is ever able to forgot the crimes committed in the Kyiv region they have established a Virtual Museum of War Memory

The main exhibit in the Virtual Museum of War is a number of custom made Street View panoramas. These 360 degree panoramic images, taken at different locations in the Kyiv Oblast, allow you to take a virtual walk through some of the horrific destruction inflicted by the invading forces. 

The Street View images for each of these virtual tours have also been added to Google Maps. This means that while exploring one of the museum's virtual tours you can click on the 'View on Google Maps' link to reveal the exact location on Google Maps. The 'i' information icon in the top right hand corner of the Street View image also reveals the name of the town where the panorama was taken.

пятница, июня 17, 2022

Cool Off with a Climate Stripe Fan!

Has Global Warming got you sweating this summer? 

Don't worry. And don't get all hot under the collar about climate change. Instead just sit back & relax and cool yourself off with a strikingly beautiful Climate Stripe Fan.

The Berliner Morgenpost's Climate Stripe Fan is the perfect answer to this summer's record breaking heat waves. Let's face it world leaders and global corporations will do nothing to halt global heating. So why not just ineffectually wave a piece of colored paper at the burning world. It is the perfect visual metaphor for the world's response to the approaching climate apocalypse.

If we are going to willfully destroy the planet then we might as well look pretty while doing it. So why not go to the Berliner Morgenpost's Climate Stripe Fan page - enter the name of your town - and print out your own personalized Climate Stripe Fan.

Currently the Climate Stripe Fan only works for German locations but if you live elsewhere in the world (and let's face if climate change is global) then you can use Ed Hawkins' original Climate Stripes website to print out a visualization of global heating in your area of the world. 

Ed Hawkins' Climate Stripes visualization of global heating over time has quickly become a data visualization design classic. In 2018 Ed Hawkins, a climate scientist at the National Centre for Atmospheric Science at the University of Reading, released this new form of data visualization to illustrate how temperatures have risen around the globe over a period of time.

In these visualizations colored stripes are used to show the average annual temperatures for every year over the course of a large number of years. The result is a very powerful and clear visualization of how temperatures have begun to rise very quickly in this century when compared to previous norms. 

четверг, июня 16, 2022

Comparing Map Projections

If xkcd's recent Madagascator cartoon map has sparked your interest in the use of map projections then you might like Engaging Data's Country Centered Map Projections interactive tool. This map allows you to view how different map projections can have a dramatic effect on how the world is visualized. It also shows that where you center a map can also radically alter how the world is perceived.

You can choose to apply any of the five map projections (Orthographic, Mercator, Mollweide, Equirectangular or Gall Peters) from the drop-down menu. You can center the map on a country or location simply by clicking on the map.You can also share maps of your country and chosen map projection by clicking on the 'share' button and then copying the website's URL address.

Gall-Peters Map Projection Overlaid on top of the Mercator Map Projection

Gall-Peters and Mercator Map Projections

Compare Map Projections is an interactive tool which allows you to view and directly compare 312 different types of map projection. Using the tool you can select to directly compare any two different projections. Which means the site provides 48,516 direct visual map projection comparisons, showing the differences and similarities, between any two of the 312 different projections.

In the Compare Map Projections 'simple mode' you can select any two of the 312 different map projections to view the two projections overlaid on the same map. For example, the map at the top of this post shows a Gall-Peters projection (in red) on top of a Mercator projection (in green). Comparing two different projections in this way provides a stark view of how projections distort our world view. Compare, for example, the huge difference in the size of Africa in the the Gall-Peters and Mercator projections (shown above).

a Tissot Indicatrix visualization of the Gall-Peters projection

Compare Map Projections also allows you to view a Tissot Indicatrix visualization using each of your chosen map projections. This visualization places a number of circles (all with the same land surface area) across the map. You can then clearly see how the selected map projection distorts different areas across the globe through the distortions of these equal sized circles. 


If you are interested in how different map projections distort the world then you will probably also like Projection Face. Projection Face is a great illustration of the distortions created by different map projections. The interactive shows how 64 different map projections effect our view of the world by showing each projection's effect when applied to something very familiar - the human face.

The distortions of each of the different projections can be illustrated further by clicking and dragging any of the mapped faces. This illustrates how the different map projections can be distorted themselves simply by changing the center of the map.

Projections Face is an interactive version of a 1924 illustration from Elements of Map Projection with Applications to Map and Chart Construction.


Comparing Map Projections is a clever visualization of different map projections. It allows you to directly compare different types of map projections to see the levels of distortions which each map projection introduces by visualizing a globe in two dimensions.

This interactive visualization provides a useful overview of the advantages and the disadvantages of specific map projections. For example if you select the much maligned Mercator map projection you can see that it scores very low for angular distortion. This means that all the lines of longitude are straight (compare the vertical lines of longitude on the Mercator projection to those on the Sinusoidal projection). The result is that a Mercator projection is really useful for navigation.

As you can see from Comparing Map Projections all map projections introduce some degree of distortion. 


If you want a little help deciding which map projection you should use for your current map project then you can use the Projection Wizard to decide on the best projection.

This map projection guide allows you to select the extent of the map view you are working with by outlining the area on a Leaflet map. Once you've highlighted your map bounds you can choose a distortion property (Equal-area, Conformal, Equidistant or Compromise).

The Projection Wizard will then suggest which map projection you should use depending on the extent and the distortion property of the map. The suggested projections are based on 'A Guide to Selecting Map Projections' by the Cartography and Geovisualization Group at Oregon State University.

A Proj.4 link is provided next to each suggested projection, which opens a popup window with a Proj.4 library. Once you've settled on your map projection you might want to check-out the Proj4Leaflet plugin for using projections supported by Proj4js with Leaflet powered maps.

среда, июня 15, 2022

How Big is Occupied Ukraine?

The New Statesman has released an interactive tool which allows you to view a map showing the area of Ukraine currently occupied by Russia. The map also allows you to drag this territory around the map so that you can easily compare this occupied area to any other location on Earth. 

If you drag the red polygon (representing the territory of Ukraine currently occupied by invading Russian forces) on the How Big is Occupied Ukraine interactive map you can directly compare this huge amount of territory to any other location.  If you use the map's search box you can also see a numerical comparison of the occupied territory with the size of your chosen country. 

According to the New Statesman (as of 14th June 2022) Russia is occupying 126,645 sq km of Ukrainian territory. This amount of land is equivalent to four times the size of Belgium, around half the area of the UK or around a quarter of the size of Spain.

The New Statesman map was made using Leaflet.js. In the Leaflet JavaScript mapping library there is no easy method for making a polygon shape both draggable and responsive to the map projection. To create polygons which automatically resize themselves according to where you drag them on the the map you can use the Leaflet Truesize plugin. This plugin makes it very easy to add draggable polygons to a Leaflet map that will resize automatically depending on the degree of latitude.

Leaflet Truesize includes links to download the plugin and an explanation of how it can be used to create a size comparison map. It also contains an example map which allows you to drag India and Mexico on a map to compare their size with other countries around the world. 

The Google Maps API does have a simple function for creating geodesic draggable polygons. This function allows you to easily add polygons which change size as you drag them north or south on a Google map. If you want to make a polygon draggable in Google Maps you simply have to set draggable and geodesic to true in the polygon's properties.

вторник, июня 14, 2022

URL Map

Map URL is an impressive interactive map which you can control by using a number of query string parameters within the map's URL address. Using the available query string parameters you can center your map at any location in the world, set the zoom level of the map and even add a marker at a specified location.

For example the map in the screenshot above was created using the URL address:

https://map.simonwillison.net/?center=51.49,0&zoom=13&marker=51.49,0

As you can tell from the URL address the map has a zoom level of 13, is centered on the location 51.49,0.0 and has a marker placed at 51.49,0.0.

Impressively URL Map can even geo-code real-world addresses. For example if you use the URL address:

https://map.simonwillison.net/?q=chicago

URL map will center on the city of Chicago. 

URL Map was created by Simon Willison. You can read more about the map and the query string parameters that the map accepts on his blog post A tiny web app to create images from OpenStreetMap maps. Simon initially created the map so that he could automatically generate images of maps. In his blog post Simon explains how you can use URL Map with his own shot-scaper tool to programmatically generate a map image for any location in the world.

понедельник, июня 13, 2022

Data Spiders

Hub and Spoke is an interactive map which shows you the eight closest airports from any location on Earth. 

Click anywhere on this map and turf.js is used to draw lines from that location to the eight nearest airports. Obviously this map will be invaluable to anybody who is desperate to know where their nearest airports are located. However, to be honest, I think most people are going to use this map to pretend that are they are in control of a massive alien spider roaming the Earth. 

This is because as you move the Hub and Spoke map the eight-legged airport finder crawls across the map to your new location. As it moves it continues to update and find the eight nearest locations. The result is (as you can see in the animated screenshot above) like being in control of a massive spider from outer space!

As a matter of interest Hub and Spoke also uses Mapbox GL's new Globe projection view. I don't think that the new globe projection is as yet officially documented in the Mapbox API. However if you check out the code of Hub and Spoke you can see that the globe projection works if you use the v2.9.0-beta release of the Mapbox GL API.

The eye-catching effectiveness of Hub & Spoke has very quickly inspired other map makers to create their own animated maps. Garrett Dash Nelson has responded to Hub & Spoke with his Massachusetts Libraries Spoke Map. Move the cursor around on this map and a ten legged spider moves around the map showing the ten closest libraries to the cursor position (as the name implies this map only works in Massachusetts.

John Wiseman was inspired to create Runways.Runways shows you the nearest airport runways which align with the direction of movement of your mouse. As you move the cursor around the map you can see all the runways around the cursor that are aligned with your direction of movement. This map uses the runway data from the amazing Trails of Wind interactive map.

And - to get us back to spiders - Darren Wiens has tweaked the original Hub & Spoke map in order to create an even more frightening spider. His Spoke Spider map uses a bigger circle for the 'hub'. The effect is a map with a bigger and more threatening creepy-crawly.

The Closest Hill Map introduces something new to the data spider theme - namely a menu. Like the other maps on this page the Closest Hill Map uses a hub and spoke system to show the closest points to a chosen location. However the Closest Hill Map allows you to choose which data you want the spider to crawl. In this case you have a choice of which types of Scottish hill you wish to see visualized on the map (Munroe, Corbett, Graham or Donald). 

 The Closest Hill Map also introduces a number of user control options which effect how the data spider moves on the map. 'Center of map' allows you to simply drag the map around and the data spider will remain in the center of the map and update to show the ten closest hills to the changing location at the center of the map. Select the 'Follow mouse' option and the data spider will follow your mouse around the map, showing the closest hills to the location beneath the cursor. The 'Click' option simply moves the data spider (or the hub) to the location that you click on.

The Poor & Poor Health in Brussels

The investigative journalism magazine Médor has undertaken an extremely detailed examination of the health of Brussels. In Bruxelles Malade they explore the extreme inequality of health and health care provision in the capital of Belgium. 

Through a detailed analysis and mapping of health, economic and housing data Médor shows how the poorest neighborhoods in Brussels suffer from low incomes, poor health and high pollution. Despite Brussels being one of the richest cities in Belgium nearly a third of its inhabitants live below the poverty line. 

By mapping out the BIM rate (levels of health insurance benefits) across the city Médor shows how the residents in the northwest of Brussels are in most need of health insurance assistance. Conversely, those people living in the southeast of Brussels are more privileged and less in need of assistance.

By exploring other demographic and economic data Médor explore how income, housing and employment all have a direct impact on the health of the residents of Brussels. Where you live in Brussels can also affect what kind of health care that you receive. Residents in the poorest neighborhoods of Brussels receive poorer dental care, less cervical cancer screenings and are more susceptible to diabetes than residents in the richer neighborhoods. In general those living in the poorest areas have less access to preventative medicine than those in the richest areas.

Médor also maps out the levels of access to green spaces across Brussels and the levels of air pollution. It shows how the poorest neighborhoods also have the worst access to green spaces and have the worst polluted air. Just two more factors that contribute to the inequality of health in the capital city.

пятница, июня 10, 2022

Wheat, War & Famine

The Guardian has published an informative story map which illustrates how the Russian invasion of Ukraine is disrupting the world's food supply and contributing to rising food prices across the world. In the Black Sea Blockade the newspaper uses a story map to illustrate and explain how the war in Ukraine is affecting the global supply of wheat and sunflower oil.

Russia and Ukraine provide around 30% of the world's exported wheat. Russia's blockade of Ukrainian ports in the Black Sea is causing major disruption, particularly to north Africa and the Middle East. Using a choropleth layer The Guardian visualizes Ukraine's major wheat growing regions and shows how they are being disrupted by Russia's military action in the south east of the country. 

Thanks to the Russian blockade of Black Sea ports wheat silos in Ukraine are still full from last year's wheat harvest. The Guardian shows how in normal times shipping routes are used to transport that wheat from the Black Sea to the Middle East and north Africa, two regions which are hugely reliant on wheat from Russia and Ukraine. Those shipping routes have now been blocked by Russian military action in the Black Sea.

The Guardian goes on to map those countries which are most at risk from food insecurity and rising food prices. This includes those countries in eastern Africa which are already suffering from extreme drought. For example in Sudan wheat prices are now 180% higher than last year. There is now a huge concern about how the combination of drought and food insecurity could combine to cause widespread famine in eastern Africa.

четверг, июня 09, 2022

The Map of Your Twitter Friends

Small World is a new application which acts like a Marauder's Map for your Twitter Friends. 

Sign in to Small World using your Twitter account and you can view all the people you follow on Twitter on an interactive map. Small World can even automatically notify you when you're in the same city as one of your Twitter friends.

According to Small World 14 of my Twitter friends are currently close-by, living somewhere in London. Small World also informs me that one of my Twitter friends from the U.S. is currently in London on a visit. If I want I can give Small World permission to e-mail when friends from outside London are visiting near-by. Which means I can then DM them if I want to suggest meeting-up.

Small World maps the people that you follow. If you have ever wondered where your Twitter followers live then you can use TweepsMap to find out. There are a number of applications that can help you map your Twitter followers. TweetsMaps however can also show you the percentage of followers you have in different countries. It even allows you to drill down to see how many followers you have in each state and in each city. 

Scratch & Sniff New York

Under the grey, decrepit streets of New York there is a shiny, modern 21st Century city just waiting to emerge. At least there is on Chris Whong's Urban Scatchoff interactive map. 

Urban Scratchoff uses aerial imagery of early 20th Century New York, captured by a plane in a 1924 flyover of the city. Underneath this 20th Century aerial imagery is another layer which contains more recent aerial imagery of New York, captured by plane in 2018. You can reveal the modern imagery by simply clicking and dragging on the map to "scratch off" the historical imagery and reveal the present-day imagery beneath. You can also switch the layer order of the two sets of aerial imagery. Place the modern aerial map of New York on top and you can then scratch the map to reveal the historical imagery below.

Urban Scratchoff isn't Chris Whong's only interactive map exploring the history of New York. Last year Chris also mapped out a collection of vintage photos from the New York Historical Society to create a virtual Stroll Down Flatbush Avenue circa 1914

The society's Subway Construction Photograph Collection, 1900-1950 includes a continuous series of photographs taken on Flatbush Avenue, from Grand Army Plaza to the present-day Barclays Center. Chris has geolocated and mapped every photo in this series to create an historical Street View tour of 1914 Flatbush Avenue.

It is not often that you get a chance to travel back in time over 100 years. I had a lot of fun walking down Flatbush Avenue on Chris's map just noting the many sights that you can now no longer see in New York. These sights include barber poles, cigar store Indians, trolley stations, hat cleaners and horse-drawn delivery carriages. 

Being a bit of nerd I also took a virtual walk along the same section of Flatbush Avenue using Google Street View. The 21st Century walk is a lot more unpleasant than the early 20th Century walk. Nowadays there are four lanes of busy car traffic (with an additional two lanes of street parking), 90% of the stores seem to sell fast food and worst of all there are far fewer hats than there used to be and not one hat cleaner!

среда, июня 08, 2022

The Sound of 6,000 Years of Deforestation

Six Thousand Years of Forests tells the story of how the UK's forests have been transformed over the last 6,000 years into croplands, pastures and cities. What was once a country covered by primeval forest is now an intensely farmed and populated landscape, with only 13% of the country covered by woodland.  

However Six Thousand Years of Forests doesn't confine itself just to the UK. In fact it also contains a marvelous scrollytelling global map showing how land use has changed around the world over the last 8,000 years.

As you scroll through this map you can see how the history of the human race is also the story of the world's deforestation. In truth the map could be called '2,000 Years of Forests', as the first major change on the map appears around the time of the birth of Christ. Around 0 AD we begin to see dense urban settlements begin to appear in northern India. 

From around 0 AD we see a very slow increase in dense urban settlements in northern India. Elsewhere, in many parts of the world, there is a loss of forests to croplands and pastures. The major intensification of change comes with the industrial revolution. Around 1800 AD we begin to see dense urban settlements grow in many parts of the world, particularly in China and then in Europe. By the year 2,000 huge areas of the world have been deforested, either to be replaced by farmland or by dense human settlements. 

One result of all this deforestation is that most of us now have no understanding of the soundscapes of a primeval forest. Six Thousand Years of Forests includes a series of magical sound recordings, created by ecologist Joseph Monkhouse, which attempt to recreate the sounds of UK woodlands at different points in history. There are four recordings in all, including re-creations of the sound of a Mesolithic Woodland (3,980 B.C.), a Medieval Woodland (1422 A.D.), a 20th Century Woodland (1962 A.D.) and a 21st Century Woodland (2022 A.D.). 

Each of these sound recordings is accompanied by illustrations and a description of some of the birds, animals and other sounds which can be heard in each recording. The 21st Century woodland recording sadly (but probably realistically) includes the sound of cars on a nearby road.

вторник, июня 07, 2022

The Noise of the City

Noisy Cities is an interactive map which visualizes noise pollution in New York, Paris and London.

Noisy Cities isn't just a mapped visualization of noise pollution. It is also a mapped sonification of noise pollution. These interactive maps of New York, Paris and London don't just use a heat map layer to visualize the average levels of road traffic and aircraft noise. If you turn on your speakers and hover over the map you can actually hear an audible representation of the noise pollution at any location. Move your mouse around and the traffic noise increases and decreases in volume based on the background traffic noise pollution.


Noisy Cities was inspired by Karim Douieb's 2020 interactive map Noisy City. Noisy City is an audible data visualization of noise pollution in the Belgium city of Brussels.

Like the New York, Paris and London maps the Belgium map visualizes average levels of noise pollution using a heat map layer. Like Noisy Cities it also uses real noise to indicate the levels of noise pollution in different parts of Brussels. Using real noise to help convey the levels of noise pollution is a really nice idea. I also really like the animated noise meters which are used on these noise pollution maps to reveal the number of decibels of noise pollution which can be found across all four cities.