суббота, сентября 29, 2018
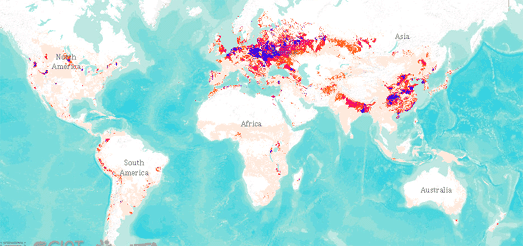
The Global Crop Map
RTBMaps shows the distribution of different crops around the world. You can use the map to see where potatoes, bananas, sweet potatoes and other root vegetables & tubers are grown across the globe. The map also includes a number of socio-economic layers which allow you to view such things as population density alongside where the different crops are grown.
Select a crop from the map's drop-down menu and you can view where the crop is grown around the world. Unfortunately RTBMaps is one of those maps which dislike legends so we have to guess what the different colors means. My guess is that the different colors have something to do with the yield of the selected crop but which colors indicate a high yield and which colors indicate a low yield is anybody's guess.
The map also includes layers which show the potential yield of a crop and crop suitability. These layers provide an overview of where yields of the selected crop could be increased and areas around the world where the land is suitable for growing the chosen crop.
If you are interested in which crops are grown in the USA then you might like Bloomberg's The Consolidation of the American Harvest which maps where different crops are grown in America.
Extreme Heat = Less Greenery
There have been a number of maps which have attempted to visualize the extreme weather that much of the world has experienced in 2018. In Mapping One Hot Summer Maps Mania explored weather visualizations from the Berliner Morgenpost, the BBC and the Washington Post. Another stark effect of the extreme heat in Europe this summer is the sharp drop in the continent's green vegetation.
The EU NDVI 2018 interactive map is a very effective visualization of how this summer's extreme heat has affected Europe's vegetation. The map includes two map views showing the Normalized Difference Vegetation Index for 2017 and 2018 side-by-side. This side-by-side visualization allows users to easily compare the amount of green vegetation in Europe this August with the amount of green vegetation measured in August of last year.
The Normalized Difference Vegetation Index (NVDI) is a simple graphical indicator that uses remote sensing measurements, typically from satellite imagery, to assess the levels of live green vegetation. The EU NDVI 2018 map uses Google's Earth Engine application to simply compare the NVDI measurement for Europe from August 2018 with the NVDI measurement for the same month in 2017.
Belgium Air Pollution
20,000 Belgiums have taken part in a citizen science project to measure air pollution in Flanders (the northern region of the country). For the project volunteers installed air quality sensors on a street facing window of their homes. These sensors measured NO2 levels during all of May 2018.
You can view the results of the project on the Curieuze Neuzen Vlaanderen interactive map. The map uses colored circles to show the amount of NO2 measured by each of the 20,000 air quality sensors. The map reveals that air pollution levels can vary widely from street to street. In general air quality in Flanders is pretty good. However there are areas with lots of air pollution, mostly in cities and the larger towns.
Antwerp stands out with nearly the whole city showing worrying levels of air pollution. The pollution is particularly poor in narrow streets with lots of traffic. However even small towns often have locations where NO2 levels are high. These tend to be in areas with lots of stop-start road traffic, such as roundabouts, busy crossroads and traffic lights.
пятница, сентября 28, 2018
The Tunnels Under Capitol Hill
Underneath the palatial government buildings on Capitol Hill lies an underground network of tunnels connecting the United States Capitol to the Library of Congress, the Senate Office Building, the Home Office Building, the Supreme Court, the House of Representatives and other government buildings.
You can learn more about Washington D.C.'s underground tunnels on the Capitol Hill Tunnels story map. The interactive map not only shows you the tunnels and the buildings that they connect but provides a history of their construction. As you progress through the story map you can learn about when each of the government buildings and their connecting tunnels were constructed and what the tunnels are used for.
The Capitol Hill tunnels aren't the only subterranean networks in the capital. You can view maps of Washington's other transportation, utility and pedestrian tunnels on the Washington Tunnels website.
The Most Dangerous Places
The Most Dangerous Places interactive map visualizes the most dangerous locations in Africa and Asia. The map provides an overview of the number of fatalities from armed conflict that have happened since the beginning of 2017.
The map uses data from the Armed Conflict Location & Event Data Project (ACLED) to plot the number of deaths from conflict per 100,000 people in each 3,000 km2. Click on any of the colored squares on the map and you can view how many fatalities there were from Jan 2017 to July 2018 (per 100,000 people). The colors of the individual squares on the map aren't actually related to how dangerous they are but provide a choropleth view of population density. The most dangerous locations are indicated by the larger red circles on the map.
When you click on a square events in the ACLED database for that location are also added to the map timeline. You can hover over the individual events on this timeline to read more details about the armed conflict which happened at that location on the selected date.
Mapping the 1848 Vienna Revolution
The 1848 Revolution in France, often known as the February Revolution, was followed by a number of other revolutionary uprisings across Europe. In Austria the authoritarian government was determined to quell the spread of the liberal ideas associated with republicanism and stop the rise of nationalist movements within its large Empire. The Austrian Empire had already restricted freedom of the press, curtailed student activities and banned fraternities. After the February Revolution it was even more keen to repress any revolutionary ideas.
Despite this repression - or because of it - in March of 1848 people took to the streets of Vienna calling for more freedom and the liberalization of authoritarian rule. The government deployed troops to forcibly end the rebellion. From March until the end of the October Revolution Vienna witnessed a number of revolutionary and counter-revolutionary battles between the rebels and the army.
The Association for the History of the Workers' Movement (VGA) in Vienna is currently hosting an exhibition about the 1848 Forgotten Revolution. For this exhibition it has created an interactive map of some of the barricades erected by the revolutionaries in Vienna during the 1848 Vienna Revolution. The locations of these barricades are shown in red on the interactive map.
You can get a better idea about how these barricades looked by clicking on the numbered markers on the map. If you click on these markers you can view contemporary paintings of the barricades. These paintings have a slide control which allow you to compare the historical view shown in the picture with the same view as it looks today in modern day Vienna.
Norway's Secret Military Sites
Norway has released an interactive map of all the military locations where it is forbidden to operate a drone and some security experts are not happy. All the markers on the Innmelding av Sensorflygning map indicates an area where it is illegal to take aerial photographs or video using a camera or any other type of sensors.
The map shows many of Norway's most secret military installations, such as Norway's secret war headquarters and the location of one of Europe's two transmitters for communicating with NATO's submarine fleet. The map also shows the location of 237 other important military and security locations. Some military and security experts have been shocked by the map's release. For example former Chief of Maritime Safety and Naval Home Guard Commander Svein Jarle Jacobsen said that the map is "disastrous for operational safety. I can't believe that they've really done this."
The Deputy Director of NSM, (Norway's National Security Authority) Frode Skaarnes, has dismissed claims that the map reveals the country's military secrets. He claims that the map shows nothing that cannot already be viewed on any map with aerial or satellite imagery and that the map "doe not say anything about what exactly is there and what these facilities are used for."
четверг, сентября 27, 2018
Global Warming is Here
Global warming has already increased temperatures around the world. You can find out how much temperatures have risen where you live on a new map from Carbon Brief,. The map shows how far global temperatures have risen since 1850 and how much they are expected to rise by the end of this century.
If you click on your location on the map you can view a temperature chart showing the rise in the local temperature since 1850 and the predicted rise up to the year 2100. The map shows that in New York the temperature has already risen by 1.7C and that by 2100 it could rise to 5.2C. In London, thanks to global warming the temperature has risen by 1.2C and could rise by another 4.5C by the year 2100.
Elsewhere around the world the map shows that in Paris the temperature has risen by 1.4C since 1850, in Tokyo temperatures have risen by 1.3C, in Sydney temperatures have risen by 1.1C, Delhi has seen a rise in temperature by 1C and in Cairo the temperature has risen by 1.6C.
If you want to know how much temperatures have risen near you and the further temperature rises that you can expect this century then just click on your location on Carbon Brief's How every part of the world has warmed – and could continue to warm interactive map.
среда, сентября 26, 2018
Tracking Nobel Scientists
Physics Today has tracked out the lifetime movements of every Nobel Prize winning physicist. Nobel Physicists on the Move allows you to watch an animated track showing the significant movements of any of the 206 Nobel physics laureate on an interactive map of the world. Select a Nobel physics laureate from the map's drop-down menu and you can view an animated map which shows where they were born, where they were educated, the places they lived & worked, and, ultimately, where they died.
The map only shows the movements of the selected physicist so it won't show you their entire career. For example if a physicist studied and then worked in the same city the map will only show when they moved to and from the city, not when they moved between institutions within the city. The only exception to this rule is that the map does mark Nobel-related milestones and the scientist's death, if they happen in the same city.
Below the map Physics Today notes that the locations that appear to have been most visited during the lives of all 206 Nobel Prize winning physicists are Cambridge, Massachusetts; New York City; Princeton, New Jersey; Cambridge, UK; and Berkeley, California.
If you want to know where every scientist ever nominated for a physics laureate was working when they were nominated then you might also like Physics Today's map The International Aspirations of the Nobel Prize. This map depicts the place of work of every nominated scientist at the time that they were nominated for the physics Nobel.
Select a year on the map and a map marker shows you where every scientist nominated for the physics Nobel Prize that year was working at the time. If you hover over a year in the timeline you can view how many scientists were nominated for the prize in that year.
The World's Trains in Real-Time
A number of interactive maps now allow you to watch the train networks of entire countries in real-time. These incredible maps show all the trains across a whole country moving at the same time.
A good example is Belgium's Train Map, which shows all of Belgium's trains moving in real-time on top of an interactive map. The map shows inter-city trains (IC), peak hour trains (P) and slow trains (L). If you click on one of the moving trains on the map you can view its entire schedule, including its expected arrival time at every station on its route.
The map also includes a handy search facility which allows you to search for individual trains by train number or to view all the trains currently travelling on a particular route.
The first real-time map of an entire country's rail network was probably the Swiss Railways Network map. This map shows all the trains on the Swiss Railway moving in real-time based on the national rail timetable.
The Swiss Railways Network Map includes the option to automatically follow any train in real-time. If you select a train on the map and select the 'follow' button (which appears in the map sidebar) the map will then automatically follow your selected train. Fans of Swiss trains will also like Trafimage, which also shows all Swiss trains moving in real-time (select the 'Train Tracker' option from the map menu).
Also See
UK Train Times - a real-time map of UK trains
Réseau SNCF en Temps Réel - shows the live position of all SNCF's trains throughout France
OSM Tchoutchou - shows real-time trains in France, Ireland, Denmark and Finland
If you can't find your country in the list above then try Travic which provides animated maps of over 700 transit systems around the world.
If you are only interested in individual towns or cities then you might be able to find a more localized live transit map using the Maps Mania real-time or transit tag.
If you prefer traveling by sea then you might want to look at MarineTraffic, a real-time map of the world's ships, boats and other sea-faring craft. Fans of planes will probably prefer Flightradar24, a real-time map of all the world's commercial flights.
вторник, сентября 25, 2018
The Australian Cancer Atlas
The Australian Cancer Atlas is a new interactive map showing the incident rates of different cancers and their survival rates across Australia. The map makes it easy for people to see where in the country incident rates of different types of cancer are higher or lower than the national averages.
Among the interactive map's many excellent features is a 'Tours' facility which provides more details about the data shown on the map and the geographical patterns in the diagnosis rates for different types of cancer. For example if you select the 'lung cancer' tour you can view a choropleth view of the average risk of being diagnosed with lung cancer across the country. As you scroll through the tour the map side-panel points out some of the geographical patterns of lung cancer, including those areas with significantly higher or lower rates of lung cancer than the national average.
The map menu allows you to select the type of cancer to view on the map. You can also select whether you want to view the diagnosis rates for males or for females. The 'tutorial' view provides a nice guide as to how to use the map and how to navigate to the different cancer types and data views.
The Deadliest Highways in the USA
The deadliest stretch of highway in California is a 3.51-mile segment of the Sierra Highway in the Santa Clarita Valley. This small segment of highway had 11 fatalities in 2015 & 2016. The second deadliest stretch of California highway in 2015 & 2016 was a 3.70-mile stretch of State Route 74 in Hemet (also known as Florida Avenue). This stretch of road was responsible for 10 fatalities.
Panish Shea & Boyle have mapped out the deadliest stretches of highway in California. In order to create their interactive map they looked at the number of fatal highway collisions in the state during 2015 and 2016. The Deadliest Highway Stretches in California includes an interactive map showing the 15 most deadly stretches of highway. The article also includes a small multiple map visualization of these 15 locations.
As well as these two different map visualizations Panish Shea & Boyle has created a list of the top 39 stretches of California highway. Overall, when broken down by county, Los Angeles County is the most dangerous county in California. 16 of the top 39 stretches of road are in Los Angeles County.
America's most dangerous highway is the US-1 in Florida. According to Geotab it has the highest number of road fatalities & fatal crashes (adjusted for average daily traffic counts) of any highway in the United States. The section of US Route 1 located in Florida has had 1,079 fatalities in the last ten years.
You can find out the most dangerous roads in each state on Geotab's new The Most Dangerous Highways in America map. A large map of the USA shows the most dangerous road in each state. You can find out more about each state's most dangerous roads in the smaller state maps beneath this large map of the USA.
You can click on the small state maps to learn how many fatal crashes and fatalities there have been on the state's most dangerous highway. You can also adjust the order that all the individual state maps are shown by the fatal crash rate, by the most crashes and by the most fatalities
Germany's Most Dangerous Roads
The Accident Atlas is a new interactive map from the German government which reveals information on where road accidents have occurred on the country's roads.
Roads on the map are color-coded by the number of accidents that have happened on each section of road. If you zoom in on the map you can view the number of accidents which occurred on each section of a road and on each side of a two-way road. The menu in the side-panel allows you to select different types of road accident, these include accidents that involved pedestrians, accidents involving bikes or those which involved motorcycles etc.
The Accident Atlas only shows road accidents which resulted in personal injuries. Accidents which resulted in only material damage are not shown on the map. Unfortunately in some federal states the police do not record the coordinates of traffic accidents. Data for these states are therefore missing from the interactive map.
Tea or Chai?
The word used for 'tea' in most languages around the world is derived from Chinese. However not all languages derive the word 'tea' from the same Chinese word. Some languages get their word for tea from the Mandarin 'chá', while in other languages the word tea derives from the Min Nan Chinese word 'te'. The result is that in most languages around the world the word for 'tea' sounds something like 'chai' or 'tea'.
You can see where tea is called chai and where tea is called tea on an interactive map created by the World Atlas of Language Structures. Their Tea Map uses blue and red dots to show where the word for tea is derived from the Mandarin 'cha' (red) and where it is derived from the Min Nan Chinese 'te' (blue).
The map provides a great example of how loan words in languages are not always geographically contiguous. Languages which share common language roots or close geographical proximity may still have a different word for 'tea', with a different 'tea' or 'chai' derivation.
The World Atlas of Language Structures has a whole Tea chapter written by Östen Dahl which has a theory about how different languages come to have different derivations of 'chai' or 'tea'. According to Dahl the difference comes from whether countries were historically on a Dutch or Portuguese trade route. The Portuguese were the first European tea importers and their trade came via Macao. The later Dutch trade routes were routed via Amoy. In Macao the word used for tea was the Mandarin 'cha'. In Amoy the word used for tea was the Min Nan Chinese 'te'. Therefore whether your language uses a derivation of 'cha' or 'te' for the word 'tea' depends if you were historically on a Dutch or Portuguese trade route.
Quartz has refined Östen Dahl's theory a little. In Tea if by Sea, Cha if by Land they agree that trade routes play a major role in determining where the words 'tea' and 'cha' are used around the world. However they suggest that the major determining factor is not the Dutch and Portuguese trade routes but the sea and land trade routes from China.
They use the same data, from the World Atlas of Language Structures, to plot where people say 'tea' or 'cha'. They believe that their map clearly shows that 'cha' is used in locations which are on a land based trade route from China. Whereas 'tea' is used in places which are on a sea based trade route.
The Min Nan Chinese 'te' is spoken in the coastal province of Fujian. Which is why this 'coastal' Chinese word is used by countries in Europe who were on the Dutch sea trade routes (except for Portugal). In inland China the Mandarin 'cha' was used for tea, which is way countries on the silk road routes usually call tea 'chai' or something similar.
понедельник, сентября 24, 2018
China's Religious Re-Education Camps
Up to one million people in China have been detained by the Chinese government because of their religion. Uighurs, Kazakhs and other Muslims in the Xinjiang Uighur Autonomous Region (XUAR) have been arrested by the Chinese authorities and imprisoned in re-education camps. People have been arrested and imprisoned for having 'abnormal' beards, for wearing veils or for avoiding alcohol. In fact people have been arrested for any sign of religious belief or cultural affiliation.
Amnesty International has created an interactive map from the reports given to them by relatives around the world. The map tells the stories of many Uighur citizens, most of them who live abroad, who have relatives that have been arrested and detained by the Chinese. You can view and explore the interactive map in Amnesty's Up To One Million Detained in China's Mass Re-education Drive.
One reason why many Uighur have been arrested is that they are suspected of having foreign contacts. This has resulted in many Uighur living abroad being wary of reporting missing relatives and for Uighurs living in China being unwilling and unable to contact relatives living abroad.
Life in the Year 2100
According to most current models of climate change life in the year 2100 is going to resemble the most dystopian visions of the future cooked up by writers of science fiction. We can look forward to a world which suffers from extreme heat, rising seas and practically unbreathable air.
For example, MIT recently modeled how climate change could impact on the future of air quality in the USA. The future air pollution model developed by these scientists estimated the likely increase in fine particulate matter (PM2.5, μg m-3) based on current climate change forecasts. The results are very worrying.
The Revelator has created an interactive map from MIT's air quality estimates for the year 2100. The Revelator's Air Pollution in 2100 interactive map shows where air pollution is expected to increase as a result of global warming. The dark areas on the map show the regions which are predicted to see the biggest increase in the annual average fine particulate matter. If you hover over a US county on the map you can see the predicted increase in PM2.5 and the predicted total PM2.5 for the selected location.
The Climate Impact Lab's Climate Impact Map visualizes how global warming will effect temperatures around the world over the rest of this century.
Using the drop-down menu you can choose to view predicted global temperatures for each quarter of the year or for the whole year. You can also choose to view the number of days which will be below 32 degrees Fahrenheit or above 35 degrees Fahrenheit. The timeline below the map allows you to view a choropleth view of any of these selected temperature predictions for the years 2020-2039, 2040-2059 and 2080-2100.
The map includes two choropleth views. The 'absolute level' shows the predicted temperatures around the world for the year selected. The 'change from historical' view shows how much the temperature will increase above the 1986-2005 averages around the globe.
The University of Hawaii has released a similar interactive map which uses expected temperature increases to predict the number of deadly days we can expect from extreme heat around the world for each year up to 2100. Heatwaves: Number of deadly heat days provides a timeline control which allows you to select any year from 1950-2100. The blue dots on the map show historic extreme heat events that have occurred around the world before 2014.
If you click on the map you can view two charts for the selected location. One chart visualizes the number of annual deadly days over time and the other shows the humidity vs. temperature for the current year.
Thanks to NOAA's Sea Level Rise Viewer we can also observe how these increases in temperature will effect sea levels.
By the end of this century the National Climate Assessment estimates that sea levels may rise by up to 6.6 feet. NOAA's interactive map uses the most accurate elevation data available to model how different extents of sea level rise will impact coastal areas in the USA. You can adjust the sea level displayed on the map by adjusting the water level tool from 0 to 6 feet.
You can also use the 'Local Scenarios' tab to view the potential impact of different sea level rise scenarios on different areas of the country. The Local Scenarios option allows you to adjust the map to view the impact of sea level rise of different orders of severity. It also allows you to see how this impacts the local area by decade (up to the year 2100).
World Radio Maps
The BBC World Service radio station broadcasts around the world in over 30 languages. The BBC World Service Radio Map is a new experimental way to switch between the different language versions of the World Service using an interactive map.
Click on a country on the Radio Map and you can listen to the BBC World Service language service provided for the selected country. The map provides an intuitive and graphical interface for choosing the language service required by listeners. It also provides an interesting way to explore some of the BBC's regional radio programs just by clicking on random countries around the world.
If you select a country on the Leaflet powered interactive map the small radio control shows the name of the World Service program which is currently being broadcast. If a BBC World Service station is not live then the radio player will play the last broadcast from that language service.
If you are fan of world radio then you might also like Radio Garden. Radio Garden allows you to listen to music from around the world, from the Pacific sounds of Radio Guam to the Siberian tunes of Radio Sabir.
Radio Garden features radio broadcasts from hundreds of countries around the world. Just click on a marker on this interactive map and you can tune in to local radio stations which provide live internet radio streams. Radio Garden is a great way to explore the sounds of different cultures around the world. It also provides an interesting insight into the broadcasting traditions of different countries.
The 3d globe interface used by Radio Garden was developed using the Cesium JavaScript library for 3d globes.
суббота, сентября 22, 2018
How to Make a Viral Map
The most popular interactive map of this week has to be the New York Times' How Connected Is Your Community to Everywhere Else in America?. The NYT interactive map visualizes the connections people have on Facebook and comes to the conclusion that we are much more likely to know people who live near us than those who live a long way away.
I know! You're shocked, right?
The conclusion that we are more likely to be connected to people on Facebook who live closer to us than all the people we don't know who live on the other side of the country is not exactly Earth shattering. The popularity of the NYT map may have something to do with the fact that it shows that even in these days of the internet and virtual online communities distance still matters in our social relationships. However the success of this visualization may also be partly due to its simplicity and speed. In other words it is a very effective visualization of the underlying data.
Hover over a county on the NYT map and you can immediately see a choropleth view showing the likelihood of people in other US counties being connected on Facebook to any of the selected county's residents. The speed of the map is especially impressive. If you move your mouse around the map you can instantly see how this close zone of friendship on Facebook plays out across the United States.
I believe that the viral popularity of the NYT map is partly down to its speed. This speed of interaction means that the map is both a great interactive data visualization and also fun to play with.
So how can you make a similar map?
Benjamin Td asked himself the same question and set out to create the same map using Mapbox GL. You can view Benjamin's resulting Friendship Map here. The Friendship Map shows exactly the same Facebook friendship likelihood data as the NYT map. It also allows you to hover over a county and instantly view the friendship likelihood in every other US county. Benjamin's map like the NYT map is also lightning quick.
If you want to know how Benjamin's map works then you can look at the map's source code. This shows you that the data for the map is loaded via a GeoJSON file. The map uses Mapbox's Feature State API to dynamically style every county based on this data every time the user hovers over a county on the map. The map is able to style the counties so quickly because Feature State updates the state of each feature at run-time without having to re-parse the underlying geometry and data.
This probably sounds a lot more complicated than it is. Luckily Mapbox has just published an easy to follow tutorial Live Electoral Maps: A Guide to Feature State. Follow Mapbox's tutorial and you will quickly be up to speed with creating lightning fast maps just like the NYT's Facebook friendship map.
However - I can't guarantee that your map will go viral.
пятница, сентября 21, 2018
Mapping Meteorite Strikes
Displayr have been busy mapping where meteorites fall. They have created a number of mapped visualizations of NASA's Meteorite Landings database. The database contains information on all known meteorite landings. The Displayer maps however only contain information on the 1,107 meteorites that were recorded as they fell.
In What Are Your Chances of Being Hit by a Meteorite Displayr unveils a number of reporting biases which make it difficult to determine where in the world you are most likely to be hit by a meteorite. Their interactive maps show that more meteorites are spotted in areas with a high population density. In other words the number of people in an area looking at the sky can effect how many meteorites are seen.
Displayr have also discovered a reporting bias in favor of larger meteorites. After mapping the size of meteorites Displayr discovered that larger meteorites are much more likely to be seen than smaller meteorites. And - if you are worried about being hit by a meteorite - you will be happy to learn that you have more chance of being killed by lightning or a tornado.
You can view a more dramatic mapped visualization of meteorite strikes on the Visualizing Meteorites across Spatial & Temporal Attributes interactive globe. This WebGL globe shows meteorite collisions with the Earth by decade.
You can select to view a decade using the timeline at the top of the page. The mass of each meteorite is represented by the size of the cylindrical projection and the color of the projection indicates the meteorite type.
The UK Isotim Travel Map
There are lots of interactive isochrone maps, which can show you how far you can travel within a set amount of time. But there aren't many interactive isotim maps, maps which show you how far you can travel for different amounts of money.
In the UK you can now use faremap to see how far you can travel on public transit for the change you currently have in your pocket. Enter a destination into faremap and it colours the whole of the UK based on the cost of train travel to the destination from your current location. Just as an isochrone map shows lines of equal time this isotim map shows lines of equal transport cost. Each color on the map shows an area of equal travel cost.
As well as showing you how far you can travel for different amounts of money faremap is also a really useful split fare map. One of the many crazy and ridiculous barriers to train travel in the UK is that for many train journeys it costs more to buy one ticket to your destination rather than buying multiple tickets for different stages of the journey.
If you enter a starting station and a destination station into faremap it will show you the cheapest split fare tickets, tell you what stations you must travel through and the cost of each ticket that you need to buy.
Twenty Years of India Lights
From 1993 to 2013 the Defense Meteorological Satellite Program (DMSP) took nightly pictures of India from space. The University of Michigan, in collaboration with the World Bank, has examined all 20 years of these satellite images to analyze how light output has changed across India during this time.
India Night Lights is a project from the University of Michigan and the World Bank to visualize and provide access to this night lights data. The India Night Lights project includes an interactive map which allows you to compare a night light view of India for any two different dates. This allows users to make a direct comparison of the amount of light measured in 600,000 different villages across the country for any two different dates during the twenty years of available data.
As well as the interactive map India Night Lights includes a number of visualizations of different 'Stories' which emerge from the data. At the moment these stories include a data visualization of how Diwali lights up India every year, the impact of electricity development projects in India and how electricity is administered in Uttar Pradesh.
The India Night Lights Project also includes an API which provides free access to India's night light data. This allows developers to access the light output at night of 600,000 villages across India for the twenty years from 1993 to 2013.
четверг, сентября 20, 2018
What Causes California Wildfires?
What do you get if you combine huge forests, global warming and lots of people? The answer is devastating wildfires. At least that appears to be what is happening in California.
According to The Guardian the extensive California forests are full of dead trees, nearly 129 million of them. Because of global warming the past five years have been the hottest recorded in California and the state has only just emerged from a six year drought. The result of this extended hot dry weather and 129 million dead trees is you have almost the perfect conditions for wildfire. All you need now is human beings.
Humans are responsible for 84% of wildfires and California has a lot of them. These people are also increasingly living in the state's high-risk fire corridors. The result is a highly combustible situation. Of course when those inevitable wildfires do occur the drought conditions mean that there is little rain and groundwater around to help put out those fires. You can learn more about Why California's Wildfires are So Bad on this Guardian story map.
The Football Fans Optimal Road Trip
Randy Olson has worked out the optimal road trip for football fans. If you undertake his optimal football fan road trip you can visit 48 different stadiums, watch 90 different teams, and witness 6 of the biggest rivalries in college football. All within this year's 51-day season schedule.
To create the Optimal Football Fan Road Trip Randy set himself a number of rules. The trip only includes Division I FBS teams, there is a maximum of one game every day, and you are allowed to fly between different locations. The use of flights means that this is more of a tour of the different stadiums rather than a strict road trip.
Here is where you can view the map of the Optimal Football Road Trip for the 2018 Season. However you will also need to refer to the trip itinerary which tells you which stadium you need to visit and on which date / game you need to be there. You can view this itinerary on How many college football teams can you watch in-person in one football season?
If you aren't a football fan then you might be more interested in Randy Olson's other optimal road trips:
The Optimal Road Trip Across the U.S.
The Optimal Road Trip Across Europe.
The Optimal Road Trip of U.S. National Parks
среда, сентября 19, 2018
School Road Safety
Zendrive has released an interactive map which allows you to check how safe the roads are around your local schools. Zendrive's School Safety Snapshot provides a safety rating for all schools in the USA based on driver behavior around each school.
To grade each score Zendrive measured the number and type of unsafe driving events, as detected by the Zendrive platform, around the school. The grades are based on a snapshot of driver behavior around the school in April 2018. You can compare each school's safety rating for 2018 to the rating given to the school in 2017.
The School Safety Snapshot interactive map works at different zoom levels. When zoomed out the map provides a choropleth view showing the overall school safety record in each state. If you select a state on the map you can then view the school safety ratings for each county. If you select a county on the map you can view the individual ratings for all the schools in the county.
Getting to Know Basle
Most Americans in Basle live in Altstadt Grossbasel. Germans living in Basle prefer the neighborhoods of Riehen and Bettingen, which are right next to the German border. The Riehen and Bettingen neighborhoods are also popular with old people. Most young adults (20–39) live in Rosental, Gundeldingen, Matthäus and Altstadt Kleinbasel. These are also some of the least popular neighborhoods for people over 50.
I discovered these interesting facts about Basle on Getting to Know Basle Districts. This data visualization tool maps out all kinds of demographic, economic and census data about each of the Swiss city's 21 different districts.
Getting to Know Basle starts with an interactive map which allows you to select any of the city's neighborhoods to view a breakdown of the district's population, including the number of residents born overseas, the average net income and the district's income & wealth inequality. As you progress through the data visualization Getting to Know Basle Districts maps out lots of different economic and demographic variables using official data from the city's Statistics Department.
Mapping Migration Flow
Migration in Latvia is a wonderfully designed interactive map which visualizes the country's internal migration flow. The map was developed by Latvia's Central Statistics Bureau.
The overall choropleth view of Latvia visualizes the number of people who have left each town and region in Latvia since the year 2000. You can also toggle this choropleth view to show the number of people who have moved into each town and region since the turn of the century.
Select a town or region on the map and flow lines are added to the map showing where people from that area moved to between 2000-2018. You can also switch this to view instead the inward migration flow of people into the selected town or region. You can also switch to view the migration flow between three different periods of time; during the last 18 years, the last 7 years or just the migration flow in the last year.
The map sidebar also breaks down some of the migration flow data for the selected town or region. This analysis includes a list of the top 30 locations where people moved to or from. It also includes a breakdown of the number of people who moved into the area during the selected time period and the number of residents who moved out of the area.
Also See
American Migration - visualizing migration flow to and from American cities
US Migration Flow Map - a map showing migration flow between US states
Population Explorer - visualizing the migration flow of towns & regions in New South Wales, Australia
вторник, сентября 18, 2018
Hurricane Florence Aerial Imagery
NOAA’s Remote Sensing Division has been flying its airplanes along the North and South Carolina coast since Saturday. The planes have been collecting damage assessment imagery in order to help and support emergency response after Hurricane Florence.
The Hurricane Florence Imagery interactive map allows you to view the latest imagery on top of a map and pre-Florence aerial imagery. The map includes three layers of aerial imagery, captured on Saturday, Sunday and Monday. The imagery captured on the 15th covers the coast from Cape Henry, Virginia to Oregon Inlet, North Carolina. The imagery from the 16th is from Charleston, South Carolina to Ocean Isle Beach, North Carolina. The imagery captured yesterday is from Myrtle Beach, South Carolina and from Oak Island to Oregon Inlet in North Carolina.
As well as aiding emergency response to the storm NOAA's aerial imagery will be used to assess the damage caused by the storm and flooding. Aerial imagery provides one of the most cost-effective ways to analyse storm damage to both property and the environment.
Mapping Gentrification in Austin
The University of Texas was commissioned by the Austin City Council to research and map neighborhoods in the city where residents are being displaced by development and the rising cost of property. You can view the results of this research on the Austin Gentrification and Displacement Indicators interactive map.
The map allows you to see which Austin neighborhoods are most vulnerable to displacement, which are becoming more vulnerable, which neighborhoods have experienced the biggest changes in property values and which ones have experienced the most gentrification. The different gentrification and displacement indicators can be selected and viewed by selecting them from the menu above the map.
Also See
Turning the Corner - mapping gentrification in Detroit
Urban Displacement - mapping gentrification and displacement in Los Angeles
Displacement Project Alert Map - mapping displacement pressures in New York City
The UCB Urban Displacement Project Map - mapping gentrification & displacement in the San Francisco Bay Area
Ungentry - mapping demographic change and gentrification in Boston
The Land Use of Berlin
Back in July Bloomberg mapped out how American uses its land. In Here's How America Uses its Land Bloomberg discovered that 41 percent of land in the contiguous United States is given over to livestock. Urban areas make up just 3.6 percent of American land use. Of course that urban land is also made up of a number of different types of land use, including buildings, parks and roads.
Now I can't tell you how any American cities are constituted by land type but thanks to Tages Spiegel we can explore how Berlin uses its land. Parts of Berlin is a story map which explores how much of Berlin is dedicated to different types of land use.
The map reveals that Berlin is a very green city. In fact the green areas of the city are as large as the five districts of Mitte, Friedrichshain-Kreuzberg, Pankow, Charlottenburg-Wilmersdorf and Spandau combined. That is quite a large proportion of the city. Another 133 square kilometers of the city are dedicated to traffic and travel. These areas are made up of parking lots, roads, railways and sidewalks. The amount of Berlin given over to traffic and travel is about the size of the districts of Steglitz-Zehlendorf, Schöneberg, Friedenau, Tempelhof and Mariendorf put together.
Stealing the Maldives
In 2014 and 2015 the Maldives Tourism Minister Ahmed Adeeb with the help of President Abdulla Yameen and a number of corrupt local businessmen began leasing out islands and coral lagoons as tourist resorts. These deals were carried out without legally mandated public bids and the profits were embezzled by Adeeb and his cronies. The government and Maldives citizens were in effect robbed of $79 million.
The Organized Crime and Corruption Reporting Project has now mapped out which islands were embezzled under the corrupt reign of the now imprisoned tourism minister. The Explore the Maldives Island Deals interactive map includes a number of options to filter the data. For example the reader can select the 'Worst Deals' option to just see the island leases which have been singled out as among the worst deals for taxpayers. The 'International Brands' option allows you to see which international hotel brands have been building on the embezzled islands. There is also an option to view 'Local Businessmen, Tycoons, and Cronies' to view which of the deals involved local citizens and who those corrupt businessmen are.
You can learn more about how this corruption occurred in How Paradise Was Carved Up and Sold. You can find out more about who benefited from these crimes in Meet the Businessmen and Global Brands that Got the Islands.
понедельник, сентября 17, 2018
Naming Philadelphia's Neighborhoods.
Everybody loves to argue about neighborhood boundaries.
Don't they?
What makes these arguments so great is that with no official boundaries no-one can prove that their views are correct. Except if you live in Philadelphia.
Residents in Philadelphia who are involved in an argument over a local neighborhood boundary can just refer to the Philadelphia Inquirer's Philadelphia Neighborhood Map. The map settles once and for all where every Phili neighborhood begins and ends.
Or does it?
In fact the Philadelphia Inquirer doesn't want to ruin your arguments. They even invite you to argue with their boundary decisions. If you click on a neighborhood on the map you can tell the Inquirer whether you agree with their choice or not. If you disagree with their name for a neighborhood you can tell them what you call it.
The Inquirer isn't the first newspaper to map their local boundaries. Back in 2015 the LA Times asked their readers to draw the boundary of the Eastside neighborhood.
The boundary of the city's Eastside neighborhood is particularly hard to define because there seems to be no official map of the area's extent. The Los Angeles Times therefore decided to settle the argument by asking their readers to draw Eastside on a map. On the L.A.'s Eastside: Where do you draw the line? map you can use the Leaflet drawing tools to draw your idea of where Eastside's boundaries lie. You can then compare your concept of the neighborhood with the view of the Los Angleles Times and with the views of other readers.
You can view more neighborhood boundary maps on this Crowdsourcing Neighborhood Boundaries post.
How to Find an Electric Citi Bike
New York has a new bike hire system which allows people to rent pedal-assisted electric bicycles. The problem for anyone who want to use one of Citi Bike's electric bikes is that there are only 200 of them dotted around the city and they can be very difficult to find. Unless you consult I Want to Ride an Electric Citi Bike.
I Want to Ride an Electric Citi Bike is an interactive map which shows you which bike docking stations have electric bikes right now. The stations with electric bikes are indicated on the map with a pink circle. The map can also alert you when electric bikes are available near you. Just select from a list of bike stations and you can receive a browser alert within ten seconds whenever an electric bike is docked in one of your stations.
You can explore all the data behind how Citi Bike's non-electric bikes are used on the NYC City Bike App. The NYC Citi Bike App is a Leaflet based interactive map which allows you to explore the number of bikes borrowed and docked from each Citi Bike station. The interactive map visualizes the most popular stations and journeys for any time of day and day of the week.
Bike stations on the map are colored to show which of the docking stations have the most bikes borrowed from them during the selected times and days. Stations colored red have more bikes borrowed from them than are docked at them. This means that they lose bikes during the selected time. The green stations are stations where more bikes are docked than borrowed. These stations therefore end up with more bikes than they start with for the selected time period.
The orange lines show the most popular routes. If you follow the orange lines from any bike station you can see the most popular journeys between that station and other New York bike stations. The data behind the map only shows where and when a bike was borrowed and docked. Therefore these orange lines don't show the actual routes between two bike stations.
The map includes the option to filter the data by time of day. Notice how the orange and green stations change during the morning and evening rush hours. In the morning the red stations (the ones losing bikes) tend to be on the outskirts of the Citi Bike network. In the evening commuting hours the red stations are concentrated in the city center. This pattern obviously reflects the movement of people into the city in the morning for work and then traveling out of the city after work.
What Did Europe Ever Do For Us?
When the UK leaves Europe next year it will finally liberate itself from the shackles of free trade and free movement. Its citizens are eagerly looking forward to their new found freedoms of paying for trade tariffs and travel visas. They are also keen to see an end to the £5 billion a year that the EU invests in the UK.
If you want to know what initiatives, companies, research projects and other organisations will be liberated from their EU funding then you should check MyEU. MyEU is an interactive map which shows some of the initiatives and projects currently funded by the EU. If you search the map by address or postcode you can where the EU invests money in the local area.
The map also includes a handy link that can help you get in touch with your local Member of Parliament. You may want to thank them for leading the UK out of Europe and putting an end to all that local inward investment.
When the UK leaves the EU its citizens will also be freed from the choice of being able to live in another European country. The free movement of workers is one of the basic principles of the European Union. In Europe citizens of countries in the EU and the European Free Trade Association (EFTA) are free to live, study, work and retire in any other EU or EFTA zone country.
1,220,000 people from the UK are currently living in other EU countries. 2,880,000 people currently living in the UK were born in other EU countries. You can find out where these European travelers live and have moved from on this interactive map. The Pew Research Center created the map to visualize how many Europeans have moved to live in other European countries.
The Origins and Destinations of European Union Migrants within the EU allows you to select an individual EU country and discover where the EU immigrants living there have originated from. You can also discover where migrants from individual countries have moved to in order to work.
Swissinfo has also been looking at the effect of free movement on the net migration rate in each of the countries in the EU & EFTA.
Which European countries attract the most immigrants? shows the difference between the number of immigrants and emigrants in each country based on movement within the free movement area. Areas with a positive net migration rate (where more people are moving to) are colored blue on the map and areas & regions with a negative net migration rate (where people are leaving) are colored brown on the map.
As you might expect migrants within Europe tend to move to regions that have the strongest economies. Conversely the areas and regions where the most people move from tend to be areas with weaker economies.
This map is featured in Swissinfo's 'migration' series. This in-depth series explores the issues of migration around the world (particularly in how it effects Switzerland) and includes a number of maps and other data visualizations of global and European migration data
Автор:
Keir Clarke
на
9:00 AM
0
коммент.
Отправить по электронной почтеНаписать об этом в блогеПоделиться в XОпубликовать в FacebookПоделиться в Pinterest
Ярлыки:
UK
суббота, сентября 15, 2018
The Exoplanet Explorer
The Exoplanet Explorer is an interesting attempt to create imagined solar systems showing the orbits of all the known exoplanets. An exoplanet is a planet that has been discovered outside the Sun's solar system. Thousands of exoplanets have now been discovered, mostly with NASA's Kepler Space Telescope.
The Exoplanet Explorer uses data from NASA to create imagined views of the three thousand exoplanets discovered so far. These views are based on the data known about the visualized planet. Alongside this imagined view of the planet you can view information about the planet, such as its temperature, size and the length of its orbit around its sun. I have no idea how accurate these exoplanet maps are but I assume they are generated based on this information.
You can see a more accurate view of the exoplanets on the Exoplanets Viewer. The Exoplanets Viewer is a WebGL visualization (with a little help from Unity) of the Universe, showing the location of all the exoplanets discovered so far. The Exoplanets Viewer shows the position of all the known exoplanets as seen from your current location and time.
The color of an exoplanet on the map represents its temperature. The green exoplanets are those situated in the habitable or 'Goldilocks' zone. The hottest planets are colored red while ice worlds are colored blue. If you are looking for a new home then you want to choose one on one of the green planets.
пятница, сентября 14, 2018
Real-Time Maps of Hurricane Florence
The Washington Post is mapping the amount of rainfall from Hurricane Florence in near real-time. The animated map in Hurricane Florence’s Deluge, in Real Time shows the track of Hurricane Florence and the cumulative rainfall that has fallen since 7pm on September 12th.
As the Post's animated map plays you can see the hourly rainfall markers sweep in following the track of the tropical storm. As the map continues to play you can see the accumulation of the rainfall as the colors darken on the map. Beneath the animated rainfall map is another map showing the size of the storm surge along the South and North Carolina coast.
The Washington Post's map uses real-time flood gauge and precipitation data from the National Weather Service and observed and predicted tidal data from the National Oceanic and Atmospheric Administration.
You can also follow the progress of the storm in real-time using the Earth animated weather map. This real-time map uses weather data from the Global Forecast System to show current wind and wave patterns around the world. The map also includes a 3 Hour Precipitation Accumulation layer which shows how much rain has fallen in the last three hours. Earth's animated weather layers really do provide a dramatic visualization of the power of tropical storms like Hurricane Florence.
Подписаться на:
Сообщения (Atom)