вторник, мая 31, 2016
Roots - The Interactive Map
The History Channel's dramatization of Alex Haley's 'Roots: The Saga of an American Family' began last night. The series presents an historical portrait of American slavery through the story of one family.
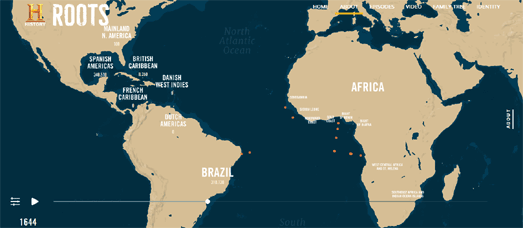
The History Channel's website for the new television series includes an interactive map visualizing the 350 year history of the Transatlantic slave trade. Mapping Slave Journeys uses data from the Transatlantic Slave Trade Database to show slave ship journeys across the Atlantic from 1525 to 1865.
The timeline running along the bottom of the map includes a number of interesting stories that the History Channel has picked out from the data, including details about individual ships, ship rebellions and the slave ship which Alex Haley believed that his ancestor, Kunta Kinte, had been transported on.
This isn't the first mapped visualization of the Transatlantic Slave Trade Database. Last year Slate released the Atlantic Slave Trade in Two Minutes, a map which animates the journeys of the slave ship journeys over 315 years.
This map visualizes the scale of the transatlantic slave trade over the centuries. It also reveals the patterns of the trade routes used and the destinations of the slave ships. The size of the ships on the map are scaled to represent the number of slaves on board. You can also click on each ship to find out under which country's flag the ship sailed.
Professor Adam Rothman and Matt Burdumy of Georgetown University have also created a series of heat maps using data from the Transatlantic Slave Trade Database.. These heat maps visualize the most important central locations in over 35,000 slaving voyages (from 1500 to 1870).
Their visualization of the Transatlantic Slave Trade Database consists of three animated heat maps showing the cumulative frequency of slave ship points of departure, the principal ports where slaves were purchased and the principal ports where the slaves were sold.
During the animation on each map a cumulative heat-map appears, revealing the pattern of slave voyages over time. For example, the map of slave voyage departures reveals how Portugal and Spain's early dominance of the transatlantic slave trade was quickly overtaken by the emergence of British slave traders.
New York Under Water
Advancing Waters is a mapped visualization of the likely effects of rising sea levels on the five boroughs of New York City. The map goes beyond most other sea level rise maps by not only showing areas which would be affected by rising seas but also provides information on the infrastructure and people in the areas affected,
You can adjust the sea level rise visualized on the map using either of the two interactive charts to the left of the map. As you adjust the number of feet of sea level rise the likely areas affected are shown in red on the map.
The two interactive charts allow you to view the number of people, schools, transportation and waste facilities which could be affected in each of the five boroughs. The locations of the affected schools, and transportation & waste facilities are also shown on the interactive map.
The map was created with D3.js. It uses the National Elevation Dataset to predict the effect of sea level rise on each of the boroughs. It also uses data from the 2010 census and the NYC Selected Facilities and Program Sites datasets to predict the likely effects of different sea level rises on the population and infrastructure of New York.
понедельник, мая 30, 2016
Slow Down GPS
In Scandinavia the If Insurance company has released a new free sat nav application which can be used with Apple and Google powered mobile devices. It works like most sat nav devices except that the app uses a child's voice when you are driving in an area where there are likely to be children around.
It is estimated that around 65% of Scandinavian drivers drive above the speed limit near schools and day-care centers. In order to remind drivers to slow down when children are around Slow Down GPS simply provides a gentle but effective reminder by switching to a child's voice in areas likely to have lots of children around.
The GPS locations of all schools and day care centers are included in the app. However if you know other centers or institutions where children often attend you can inform Slow Down GPS using their simple crowd-sourced map.
At the moment the Go Slow GPS app only works in Sweden, Finland and Norway. It is such a great and simple idea however that I'm sure that there could be a global demand for this app.
Mapping the History of the World
Hoagy Cunningham and Misha Wagner recently decided to map the entire history of the world. The result of this ambitious undertaking is Timeglo.be, a d3.js powered interactive globe plotting the location of over 20,000 events across the whole of recorded history.
Timeglo.be uses data from Wikipedia and DBpedia to show historical events on an interactive 3d globe. The map provides a global overview of any chosen time period, giving a really interesting cross section of world history at any given point in time. You can search for events by date and by key words and then follow the links provided to view more detailed information on Wikipedia.
Timeglo.be also serves as a visual presentation of Wikipedia’s biases and the overall bias in English language content generation. For example, comparing the USA and China from 1850 to 1870, brings up the U.S. Civil War and the Taiping Rebellion. However there are literally hundreds of times more Wikipedia entries for the U.S. Civil War than there are for the Taiping Rebellion.
Chronas is another interactive map which maps Wikipedia data to provide a view of historical events across the globe.
Chronas not only maps historical events but also provides a mapped overview of country boundaries for any given date. If you select a year from the time slider, running along the bottom of the map, the map will update to show how the world looked at the chosen time.
If you then click on a country or geographical area on the map a Wikipedia article on the selected historical region will open in the map sidebar. For example, if you select the year 573 AD from the time slider, you can select the Visigoths region on the map to learn more about these nomadic tribes.
Of course it isn't only country boundaries which have changed over the history of the Earth. The planet has also physically changed since the dawn of time. This interactive 3d globe from Dinosaur Pictures travels back 600 million years to the dawn of multi-cellular life on Earth and shows how planet Earth has physically evolved throughout its history.
What Did the World Look Like actually presents a 3d globe which shows how the Earth looked at any period in its history. The site includes two menus, which allow you to change the era visualized on the interactive 3d globe. The menu at the top of the page allows you to select an era by age and the menu at the top right allows you to select a view based on the stages of life on Earth and by geologic period.
воскресенье, мая 29, 2016
Maps of the Week
I've been thinking a lot about the potential of Terrapattern this week. Terrapattern uses deep learning machine vision techniques to search for similar patterns in satellite imagery.
It is a technology which could truly revolutionize a number of fields. For example in archaeology aerial imagery of historical sites is often used to determine sub-surface features based upon features which can be seen on the ground - especially when viewed in detailed aerial imagery. If you fed in the satellite image of a round barrow into Terrapattern then it could identify other locations with similar features.
At the moment Terrapattern only works for Pittsburgh, San Francisco, New York and Detroit. However other cities are coming soon. The Terrapattern about page has examples of things that you might want to try searching for, such as baseball diamonds, airplanes or solar panels. Part of the fun of Terrapattern however is just clicking on the map to see how quickly it finds other similar looking locations.
That 'about' page also includes a lengthy 'How it Works' explanation of the neural network behind Terrapattern.
Blast Map is an interactive map showing underground nuclear tests carried out by countries across the globe since 1963. 1963 was the year the Partial Test Ban Treaty came into force, which prohibited all test detonations of nuclear weapons except underground. Using data from the Northern California Earthquake Data Center the map shows all seismic events which have been determined to be not geological in nature but were instead caused by either quarry blasting or nuclear testing.
Blast Map shows the location of these quarry blasts and nuclear test sites around the world. The chart beneath the map shows the magnitude and date of each of the blasts. The chart and map are synchronized together so that the chart automatically updates to reflect the data in the current map view. You can also use the chart to refine the data shown on the map by range of magnitude and date.
The map sidebar provides links to significant nuclear testing events. For example, if you click on the 'Soviet Nuclear Archipelago' link you can view a map and chart view of soviet nuclear testing from 1964-1991. You can read a little more about the significance of these highlighted testing events and how the map was made on this Adventures in Mapping blog post.
Mark Evans has used the Google Maps API to create a hypnotic visualization of commuting flows, showing the distances and 'journeys' that American's make to and from work.
Using the ACS Commute Map you can zoom in on any U.S. county and view an animated map showing where people live and work. The maps don't show the actual journeys that commuters make but do give a great sense of how town and city centers suck in commuters from surrounding suburbs.
The data for the maps comes from the American Community Survey. You can learn more about how the map was made from this data on Mark's blog post ACS Commuter Data Visualizations. Mark's ACS Commute Map was originally inspired by Alasdair Rae's mapped visualizations of commuting in the Bay Area.
пятница, мая 27, 2016
Mapping the 1947 Partition of India
In 1947 the British Indian Empire was partitioned into the Dominion of Pakistan (which later split into Pakistan and Bangladesh) and the Union of India (later the Republic of India). One result of the partition was that 14 million Hindus, Sikhs and Muslims were forced or decided to leave their ancestral homes and move their families to other countries. It was probably the largest mass migration event in human history.
The 1947 Partition Archive is documenting and sharing eye witness accounts of individuals affected by the Partition of British India in 1947. These individual stories of post-partition migration can be viewed on an interactive map. The map allows you to access oral histories of pre-Partition life, post-Partition migration and the ensuing life changes brought about by this migration.
If you select an individual marker on the 1947 Partition Archive Map you can click through to read the individual accounts of living through the partition. The markers on the maps, indicating the individual mapped histories, can be filtered by where the individuals migrated from or where they migrated to.
четверг, мая 26, 2016
Searching for Map Patterns
A few years ago Onformative developed an algorithm, called GoogleFaces, that scans Google Maps satellite imagery looking for patterns in the landscape that we might recognize as resembling human faces.
Terrapattern has taken this idea of detecting patterns in aerial imagery and developed it into something that is actually very useful. Using deep learning machine vision techniques Terrapattern is able to accept a user input (a selected area on a satellite map) and search for other locations which look the same.
For example, if you click on a golf course sand trap on the aerial map Terrapattern will instantly find other locations with golf course sand traps. Click on a stretch of a nice river bank with tree cover and you will be shown other locations where Terrapattern recognizes the same patterns in the imagery.
At the moment Terrapattern only works for Pittsburgh, San Francisco, New York and Detroit. However other cities are coming soon. The Terrapattern about page has other examples that you might want to try searching for, such as baseball diamonds, airplanes or solar panels. Part of the fun of Terrapattern however is just clicking on the map to see how quickly it finds other similar looking locations.
That 'about' page also includes a lengthy 'How it Works' explanation of the neural network behind Terrapattern.
Bend Me Over Backwards
For the next thirty days you can follow actor and performance artist Shia LaBeouf on a real-time interactive map. If you want you can even pick LaBeouf up and take him wherever you want.
#TAKEMEANYWHERE shows LaBeouf's journey so far and his current position. Every day he, and his two fellow travelers, are tweeting the co-ordinates of a location and the first person to arrive can then take them anywhere that they want.
LeBeouf's has in the past been criticized for plagiarism in his art and I can't help noticing the similarities between #TAKEMEANYWHERE and my own performance art piece #BendMeOverBackwards.
The Nuclear Weapon Testing Map
Earlier this month the Future of Life Institute partnered with NukeMap to create 1100 Declassified U.S. Nuclear Targets, an interactive map showing all U.S. nuclear targets around the world in 1956.
Of course the nuclear arms race didn't end in 1956. In fact the USA, Russia and many other countries around the world have continued to carry on developing their nuclear capabilities. One way of determining who is continuing to test nuclear weapons is by analyzing seismic records. Which is exactly what Blast Map has done.
Blast Map is a map showing underground nuclear tests carried out by countries across the globe since 1963. 1963 was the year the Partial Test Ban Treaty came into force, which prohibited all test detonations of nuclear weapons except underground. Using data from the Northern California Earthquake Data Center the map shows all seismic events which have been determined to be not geological in nature but were instead caused by either quarry blasting or nuclear testing.
Blast Map shows the location of these quarry blasts and nuclear tests around the world. The chart beneath the map shows the magnitude and date of each of the blasts. The chart and map are synchronized together so that the chart automatically updates to reflect the data in the current map view. You can also use the chart to refine the data shown on the map by range of magnitude and date.
The map sidebar provides links to significant nuclear testing events. For example, if you click on the 'Soviet Nuclear Archipelago' link you can view a map and chart view of soviet nuclear testing from 1964-1991. You can read a little more about the significance of these highlighted testing events and how the map was made on this Adventures in Mapping blog post.
среда, мая 25, 2016
The Game of Thrones Tracking Map
Despite all the sterling work by the LOTR Project to create interactive maps of Middle Earth the most mapped fictional landscape in the fantasy world has to be Westeros.
If you don't believe me here is just a selection of some of the Game of Thrones interactive maps that have featured on Maps Mania in the last two years:
- Game of Thrones: The Kings Road Map
- A Map of Ice and Fire
- The Interactive Game of Thrones Map
- The Westeros Map
- Arya's Journey
Jonathan was commissioned by Random House to create the maps for the published novels. While the interactive maps above don't re-use Jonathon's cartography the underlying maps are obviously influenced by his knowledge of the geography of a Game of Thrones.
Now that the sixth season of a Game of Thrones is upon us there has obviously been a rush of new interactive maps appearing on the scene. Of these new maps I'd pick out Collider's Where is Everybody? map as worthy of mention for attempting to do something a little new.
The Collider map is updated after each episode of the HBO drama to show the last known location of each of the characters. It therefore provides a handy guide to keep track of your favorite characters during season six of a Game of Thrones.
Rural Life on Map & Film
Over the last year I've lost more than a few hours browsing through the BFI's interactive map of Britain on Film. The map is an amazing way to step back in time by finding and watching vintage film footage of locations throughout the UK.
Britain on Film contains thousands of vintage films from all over the UK which you can search for by location and then watch for free. This collection of films has just got even larger as the BFI has now added over 750 films, dating from 1900 to 1999, exploring rural life in Britain.
You can search this new collection on the Britain on Film map by selecting the 'Rural Life' link in the map sidebar. All the vintage films from the collection will then be shown on the map by location. Select a marker on the map and you can view the chosen historical film.
вторник, мая 24, 2016
The Nice Guys Maps of 1970's LA
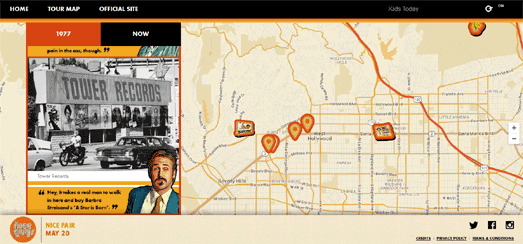
The Nice Guys, starring Russell Crowe and Ryan Gosling, is set in 1970's Los Angeles. If you want to re-familiarize yourself with LA in the '70's before seeing the movie then you should take a look at The Nice Guys Map.
This Google Map takes you on a little tour of some of LA's most famous locations, including the Sunset Strip, the Hollywood Sign and Venice Beach. Each of the featured locations is accompanied by photos from 1977 and 2015. This allows you to directly compare the LA of today with the LA of the 1970's and assess how Los Angeles has changed over the last thirty odd years.
The Google Map itself has been given an appropriate 1970's orange tinge using the Styled Maps feature of the JavaScript Maps API.
Bird Spotting on the Okavango
In May of last year a group of explorers and scientists traveled down the Okavango Delta in Botswana. The aim of the expedition was to find new species and collect data on the environment of this mighty river.
Thanks to National Geographic's Into the Okavango you can follow the progression of the expedition and explore the Okavango yourself via an interactive map. Into the Okavango is an animated map which shows the paths taken by four of the explorers. The map automatically plays through the whole expedition but you can take control of the map by pressing the pause button and then using your scroll wheel to progress through the map at your own pace.
As well as the paths taken by the four explorers the map shows the location of bird's spotted along the river during the expedition.
The data from the Okavango expedition and data from previous expeditions of the Okavango Delta is available from the Okavango Database and API. You can navigate to the data by using the 'Data' button on the interactive map. The database and API gives you access to data on animal sightings, audio recordings and photographs.
It is possible to query the database and automatically view the results on an interactive map. For example you can enter 'hippo sightings' into the data explorer and view the results automatically output on a Leaflet powered map.
Put the Wind Beneath Your Maps
You can now add animated wind layers to your maps thanks to a new API from Windyty.
Windyty is an animated wind forecast map based on NOAA wind data. It allows you to view forecast wind patterns for the next five days on top of an interactive 3d globe. The map includes a number of other animated weather layers (including cloud cover and temperature) and allows you to view animated wind patterns at a number of different altitudes.
The Windyty API allows you to add the same animated weather forecast layers to your own interactive Leaflet.js maps. You can see the API in action and some example source code for adding a Windty layer to a Leaflet map on this Hello World demo map. For now the API is free to use.
If you want to add an animated wind layer to other interactive map platforms then you should have a look at Windy-JS. With Windy-JS Esri has adapted Earth.nullschool.net's original 3d globe of animated wind into a canvas layer which can be added to a variety of mapping APIs.
Esri has created a demo map with Windy-JS, Wind Animation, which allows you to view global wind conditions animated on top of an Esri slippy map.
понедельник, мая 23, 2016
Mesmerizing Commuting Maps
Mark Evans has used the Google Maps API to create a hypnotic visualization of commuting flows, showing the distances and 'journeys' that American's make to and from work.
Using the ACS Commute Map you can zoom in on any U.S. county and view an animated map showing where people live and work. The maps don't show the actual journeys that commuters make but do give a great sense of how town and city centers suck in commuters from surrounding suburbs.
The data for the maps comes from the American Community Survey. You can learn more about how the map was made from this data on Mark's blog post ACS Commuter Data Visualizations. Mark's ACS Commute Map was originally inspired by Alasdair Rae's mapped visualizations of commuting in the Bay Area.
Turtle Tracking Maps
The WWF Species Tracker is a wonderful Google Map which allows you to follow the movements of a number of animals around the world. The map includes mapped tracks of a number of polar bears, yellowfin tuna, jaguars and whales. However, on World Turtle Day, you will probably want to use the map to follow the movements of marine turtles.
The World Wildlife Fund tracks several populations of marine turtles around the world. If you select the Marine Turtle link from the WWF Species Tracker sidebar you can view the current position and tracks of turtles off the coast of Australia, the Caribbean and the Persian Gulf. In total you can view the tracks of 8 different marine turtles in the Persian Gulf, 4 turtles in the Caribbean and 5 turtles off the coast of Australia.
Map Reporting in Local Government
There seems to be a mini resurgence in the use of interactive maps by local government as a means to gather information from residents about environmental problems in their neighborhoods.
In the early days of the Google Maps API a number of 'pothole' maps emerged. These, usually non-government, maps were developed to allow anyone to report where roads needed urgent repair. Interactive maps are obviously a very handy resource to use to gather local information and it quickly became apparent to some developers that this kind of map reporting system needn't be restricted to just the reporting of poor road conditions.
In the UK FixMyStreet developed a system which allows residents to report the existence of a wide range of local environmental problems, such as graffiti, fly tipping, broken paving slabs or poor street lighting. The system allows residents to enter the location of a problem on an interactive map. FixMyStreet then sends a report of the problem to the relevant local government agency.
In the United States 'Vision Zero' initiatives have been instituted by a number of cities to try and reduce the number of traffic accidents. At the the heart of these initiatives are map reporting systems which canvas local opinion on safety concerns and gather local knowledge of the city's streets. You can learn more about these initiatives on the Vision Zero - New York and Vision Zero - Boston websites.
In the UK Bristol City Council has recently released the Bristol Bugbears map reporting initiative to gather information from local residents on cycling and pedestrian problems in the city. The Bristol Bugbears campaign is designed to improve the experience of cyclists and pedestrians. Using the Bristol Bugbears map local citizens can report the locations of problems in the city and view the cycling and pedestrian problems reported by other local residents.
The Vision Zero and Bristol Bugbears initiatives are all fixed-term campaigns. So we seem to be seeing a move away from open-ended map reporting systems in local government. These are being replaced with budgeted fixed length campaigns, with identifiable goals & aims, to address specific local problems.
воскресенье, мая 22, 2016
Maps of the Week
This week Swiss newspaper Tages Anzeiger created an interesting mapped data visualization exploring the demographics of Zurich neighborhoods. The visualization centers around the magically transformation of bus route lines into interactive line graphs, in order to highlight the demographic differences between the different neighborhoods.
The interactive map in Zürichs Gegensätze presents two bus routes in the Swiss city of Zurich. As you scroll through the visualization the bus lines transform into interactive line graphs showing the demographic differences around each bus-stop, such as average incomes, average age, the immigrant population, birth & death rates, male & female ratios and marriage & divorce rates.
If you click on the 'schematisch' and 'geografisch' links at the top of the page you can switch between the graph and map view. When you switch between the two views the route polylines magically animate between a route line on the map and a demographic line graph.
This week the Center for America Progress also released an impressive mapped visualization. The Disappearing West interactive map allows you to explore the huge amount of natural land which is being lost to development in the Western United States.
Every 150 seconds a football field's worth of natural open land is lost to development in the Western United States. Scientists from the Conservation Science Partners have analysed satellite imagery and public data to determine how much land in the West is being developed, at what rate and why this is happening.
The map presents a choropleth view of the Western United States showing how much land has been lost to development in every county between 2001 and 2011. If you press the 'Local' button you can view a heat-map of the same data, providing a more localized view. Press the 'State' button and you can view a choropleth layer showing the amount of land lost in each state. The map also includes a timeline which allows you to select a different year to see how much land was lost from 2001 until your chosen year.
Jewish Warsaw is a fascinating account of the long history of the Jewish community in the Polish capital. It examines the city through the eyes of some of Warsaw's most influential Jewish citizens and examines some of the important, often turbulent, historical events that have effected Jewish citizens in Warsaw.
The Janusz Korczak section of Jewish Warsaw presents two interactive mapped journeys exploring the life of the famous Jewish educator and children's author. One of the maps takes you on a journey through Korczak's life in pre-war Warsaw. The other map recounts Korczak's bravery in World War II and his deportation and death at Treblinka extermination camp
In the Past and Present section you can lean more about the history of the Jewish community in Warsaw through a series of interactive vintage maps of the city. This section includes an account of the long history of Jews in Warsaw, a mapped account of the Jewish ghetto and the Holocaust in World War II and a number of walking tours through the Warsaw of today.
суббота, мая 21, 2016
Bike to Work Color Wheels
DataShine has created an interesting visualization of commuting journeys made by bike in a number of UK cities. The map uses data from the 2011 census to show the number of bike commuters between different neighborhoods.
The flow lines on the Great British Bike to Work map show neighborhood to neighborhood biked commutes which are made by more than 24 people. The colors of the flow lines on the map reveal the direction of travel.
Looking at London you can clearly see that the main centers of employment are in the city and the West End. It also appears that bike commuters who live south of the Thames are prepared to commute further distances than north Londoners. This could be partly due to the scarcity of the London Underground service in south London.
пятница, мая 20, 2016
The New York Zoning Code
Forty percent of Manhattan's buildings couldn't be built under the present New York zoning code. Under current zoning regulations these buildings would not get planning permission because they are either too tall, have too many apartments or too many businesses.
The New York Times has created an interactive map showing Which Buildings Couldn't be Built in Manhattan Today. The footprints of the buildings which would fall foul of the current zoning code are colored on the map. You can find out which particular codes they would break by using the filters in the map sidebar.
This article also includes static maps of the same data used in the interactive maps. These static maps highlight Manhattan buildings which would fail to meet New York's zoning codes for height, the number of apartments and the number of commercial businesses.
Bike to Work Day Around the World
Strava held its first Global Bike to Work Day on May 10th. On that day 148,602 cyclists around the world rode their bikes to work and uploaded their routes to the Strava app. You can view all of these cyclists setting off for work on Strava's animated Global Bike to Work Day map.
The map uses CartoDB's Torque library to animate uploads made to Strava throughout May 10th. In truth the map doesn't really communicate much aside from where Strava has penetrated the global market.
The day / night layer which moves across the world as the animation plays out is a nice touch. It is kind of interesting to view the sudden burst of activity as the day starts around the world, However again this layer doesn't reveal much apart from the fact that most people around the world work during daylight hours.
четверг, мая 19, 2016
Mapping Displacement in the Bay Area
UC Berkeley, in collaboration with researchers at UCLA, have created an interactive map showing where gentrification and displacement is happening in the San Francisco Bay Area. The map reveals that more than half of low-income households in the San Francisco Bay Area live in "neighborhoods at risk of or already experiencing displacement and gentrification pressures".
The UCB Urban Displacement Project Map uses data from the census, various other sources and the project's own research. The initial map view highlights the projects own 'Displacement Typologies' showing the San Francisco Bay Area neighborhoods undergoing displacement and gentrification.
The map also includes a number of other data layers which allow you to explore San Francisco demographic data, changes in house and rental prices, employment density, income levels and the proportion of renter households.
You can learn more about how displacement effects individuals with the the Anti-Eviction Mapping Project's Narratives of Displacement: Oral History Map. This map allows you to directly listen to the stories of those fighting gentrification and eviction in the San Francisco Bay Area.
The oral history map documents the effects of displacement on individual lives by foregrounding the stories of those who have been, or are being, displaced by gentrification. The map includes thousands of markers showing where people have been displaced through no-fault evictions. The blue markers allow you to listen to the SoundCloud recordings made by San Francisco residents negatively affected by gentrification and displacement.
The India Air Quality Map
Ten Indian cities are in the top fifteen most polluted cities in the world, according to the WHO Global Urban Ambient Air Pollution Database. To raise awareness of the current air quality in Indian cities the Hindustan Times has created an air pollution map, which shows real-time readings from monitors throughout India.
The Hindustan Air Quality Map allows you to view real-time air pollution maps in 20 Indian cities. Each of the city maps use numbered and colored markers to show real-time readings from air quality monitors. The numbers represent the latest Air Quality Index score recorded by the monitor. The colors of the marker provide a quick overview of how safe or unhealthy the air quality currently is.
If your city doesn't appear on the Hindustan Air Quality Map you might be able to find nearby real-time air pollution readings on the World Air Quality Index map.
среда, мая 18, 2016
Mapping Jewish Warsaw & the Vilnius Ghetto
Jewish Warsaw is a fascinating account of the long history of the Jewish community in the Polish capital. It examines the city through the eyes of some of Warsaw's most influential Jewish citizens and examines some of the important, often turbulent, historical events that have effected Jewish citizens in Warsaw.
The Janusz Korczak section of Jewish Warsaw presents two interactive mapped journeys exploring the life of the famous Jewish educator and children's author. One of the maps takes you on a journey through Korczak's life in pre-war Warsaw. The other map recounts Korczak's bravery in World War II and his deportation and death at Treblinka extermination camp
In the Past and Present section you can lean more about the history of the Jewish community in Warsaw through a series of interactive vintage maps of the city. This section includes an account of the long history of Jews in Warsaw, a mapped account of the Jewish ghetto and Holocaust in World War II and a number of walking tours through the Warsaw of today.
The Vilnius Ghetto was a Jewish ghetto established and operated by Nazi Germany in the city of Vilnius, Lithuania. During the two years of its existence, starvation, disease, street executions, maltreatment and deportations to concentration camps and extermination camps reduced the population of the ghetto from an estimated 40,000 to zero.
Exploring the Vilnius Ghetto: A Digital Monument is a Leaflet powered map that shows over two hundred points of historical significance, pulled from memoirs, archives, original Ghetto documents and artifacts, and oral and historical accounts. Users can explore the map on their own, using filters to find places and events of interest; or they can follow the built-in stories.
The Movie Map of the World
If you've ever wanted to visit the stunning locations featured in a Game of Thrones or Lord of the Rings then you should have a look at Expedia's interactive map of the best locations seen in film and television.
Expedia's World on Screen map features the shooting locations of some of your favorite films and television shows. Select a movie location on the map and you will be taken to a more detailed map featuring some of the shooting locations used in the selected film. For example, if you click on the Cardiff marker in Wales, you can view a map of the city highlighting some of the locations which have featured in the famous BBC drama. The Doctor Who map also shows the location of the Doctor Who Experience interactive museum.
Expedia promise to add more movie and television locations to the map in the coming months.
вторник, мая 17, 2016
Say Goodbye to the West
Every 150 seconds a football field's worth of natural open land is lost to development in the Western United States.
Scientists from the Conservation Science Partners have analysed satellite imagery and public data to determine how much land in the West is being developed, at what rate and why this happening. You can read more about their findings and where land is being lost to development in a new report from the Center for American Progress.
You can jump right in and start exploring where land is being lost to development on the Disappearing West interactive map. If you want to learn a little more about the reasons why this land is being developed and why it is important to protect natural land then you might want to first read the Center for America Progress' The Disappearing West article.
The map presents a choropleth view of the Western United States showing how much land has been lost to development in every county between 2001 and 2011. If you press the 'Local' button you can view a heat-map of the same data, providing a more localized view. Press the 'State' button and you can view a choropleth layer showing the amount of land lost in each state.
The map also includes a timeline which allows you to select a different year to see how much land was lost from 2001 until your chosen year.
Mapping Iowa's Growth
This building age map allows you to see how Iowa City has developed over the last 200 years. Like other building age maps the Iowa City map colors building footprints to show the year when each building was constructed. However this map also includes a couple of other options.
If you press the 'Animate' button on the Build Year of Structures in Iowa City map you can watch buildings being added to the map by year of construction. This gives you a nice sense of how urban sprawl works as new suburbs are added to the city over time.
You can see the same picture of urban sprawl in Dutch cities using the timeline on this Building Age Map of the Netherlands and by using the date buttons on this City of Edmonton Building Age Map.
It is worth remembering that these animated building age maps do not present a true or accurate picture of how city's have developed over time. These maps only show the building ages of current buildings. Older buildings which have been knocked down (often replaced by newer buildings) do not appear on these maps.
The Iowa City map also includes a nice bar chart visualization which shows how many buildings were built in each year. This chart allows you to see the dates of the major periods of development in Iowa City. I understand that you should ignore the 1900 spike in the chart. This spike is probably due to buildings with no known building age being automatically tagged as being built in 1900 in the City of Iowa's data.
The Rio Olympics - Inside & Out
This past week both Mapbox and Google have been looking forward to the 2016 Rio Olympics. In doing so they also both playing to their mapping strengths.
Mapbox's Rio 2016 takes you on a mapped tour around the 32 venues of the 2016 Rio Olympic Games. The map uses DigitalGlobe's latest high resolution satellite imagery to take you on a guided tour of Rio de Janeiro and the venues being used in the games.
The tour is a pretty neat demonstration of some of the capabilities of Mabox GL. It uses the flyTo function to smoothly interpolate between the different venues and locations in the tour. It also uses bearing to rotate the map view to provide different perspectives on DigitalGlobe's satellite imagery of Rio de Janeiro.
These days the Google Maps API looks very clunky next to Mapbox GL. However Google does still have Street View. This allows Google to show you panoramic imagery from inside the Maracanã Stadium. I suspect that as the Olympic Park and other venues near completion Google may release more Street View imagery related to the 2016 Olympic Games.
Any new imagery will be available to developers via the Google Maps API, However the Maps API is an afterthought these days for Google and the company seems now to view Google Maps very much as a passive consumer product rather than as a tool for developers.
In preparation for the Olympic Games therefore Google has been concentrating on providing Indoor Maps of the 2016 Olympic Venues. When you zoom in on a 2016 Rio Olympics venue on Google Maps you should now see indoor maps of the arena. At the bottom right-hand side of the map you can use the numbers to navigate between the floors and levels inside the venue. If you select a floor number the map will show an indoor map of the selected level, with points of interest such as concessions, restrooms and ATM's highlighted on the venue plan.
You can see the new indoor maps in action on Google Maps at the Maracanã Stadium.
понедельник, мая 16, 2016
Mapping Property Taxes
Recently the city of Edmonton increased property taxes. These property taxes are based on the estimated value of a property on July 1st of the previous year. This results in some interesting spatial patterns between those who get to pay more in property tax and those who get to pay less.
Home Tribe has released an interactive map providing a City of Edmonton Assessed Values Comparison 2015-2016. The map uses a similar model to Home Tribe's recent City of Edmonton Building Age Map. However, whereas building footprints in the building age map were colored by year of construction. in the new map all buildings are colored by whether properties were assessed to have increased or decreased in value between 2015-2016 (and by how much).
This Home Tribe blog post points out some of the interesting findings from visualizing the data on an interactive map, For example, those living north of 137 Avenue get to pay more property tax, whereas their neighbors on the south of the road get to pay less.
It's Isochronic Greased Lightening
Walkalytics is a new service for providing pedestrian time analysis, or put more simply - walking times. Walkalytics provides an API to access its walking time analysis. The API has a paid subscription model, although I believe there is free limited access for developers.
You can view Walkalytics in action on this isochrone demo map, which allows you to query walking times in Switzerland, Germany, Austria, Boston and New York. To view the walking times from any location you just need to click on the map. The map will then instantly display a walking times isochrone layer, showing how far you can walk from that location within different lengths of time.
Walkalytics pedestrian time analysis is based on OpenStreetMap data and they claim they are accurate to within five meters.
Route360 also has an API to provide developer access to travel time data. The API has been designed to provide simple access to the Route360 isochrone travel time library.
Using the Route360 JavaScript API you can add a travel time isochrone layer to an interactive map. The API allows for users to add bike, car or walking travel-time isochrone layers. It also includes options to add a time control, so that the transit isochrone travel times will adjust to a specific transit network's schedule of operations.
If you are more interested in finding out how far you can travel on public transit then you should check out Mapnificent. Mapnificent shows you how far you can travel on public transport for any given length of time, in a number of major cities around the world.
Drop a marker anywhere on one of Mapnificent's city maps and adjust the slide control to define your commuting time. The map then displays the commutable area using an isochrone layer on the map. You can adjust the slide control to see how far you can travel for longer or shorter commute times.
Isochrone Maps of Europe is a beautiful looking series of maps visualizing train travel times across the continent. The series includes a number of static isochrone maps which visualize the travel time by train across Europe from a number of major cities.
The travel times for each city map were calculated using the Swiss public transport API. The travel time data was then converted into contour lines using conrec.js, and then plotted as paths using d3.js and finally overlaid on a Leaflet.js map.
The Road to Rio
Rio de Janeiro has experienced a huge number of construction projects over the last few years, many of them related to the upcoming 2016 Olympic Games. However these are only the very latest developments to take place in a city which has been continually growing since it was founded in 1565.
You can now explore the social and urban evolution of Rio de Janeiro since its foundation on the imagineRio interactive map. At the heart of imagineRio is a timeline control which allows you to view historical maps, plans and images of the city from 1500 up to the present day. When you choose a date from the timeline the map sidebar updates to show the media you can add to the map. For example, most dates include a number of vintage maps of Rio which you can select to view them overlaid on the interactive map.
When you use the timeline to change the date the interactive map also updates to show the building footprints of important Rio buildings of the time period selected. You can select the individual footprints on the map to learn about their name, date of construction and owner /creator.
If you want to know more about how these elements on the map were made interactive you can read Probing on a Tiled Map, a blog post explaining how PostGIS is used to query the imagineRio map and return data based on that query.
Magic Polylines in Zurich
Scroll down the page on this map of Zurich and the bus route lines on the map magically transform into line graphs.
Zürichs Gegensätze is an interactive map which explores the demographic makeup of the population around bus-stops on two bus routes in the Swiss city of Zurich. Using this map from Tages Anzeiger you can explore population data in a 500 meter radius around each bus-stop on lines 31 and 32 in Switzerland's largest city.
The background map on Zürichs Gegensätze shows the routes of the 31 and 32 bus lines. However, as you scoll down the page, the bus lines transform into interactive line graphs showing the demographic differences around each bus-stop, such as average incomes, average age, the immigrant population, birth & death rates, male & female ratios and marriage & divorce rates. The map also reveals some of the environmental differences around each bus-stop area, such as the number of trees & green spaces and the number of bars & restaurants.
If you click on the 'schematisch' and 'geografisch' links at the top of the page you can switch between the graph and map view. When you switch between the two views the bus route polylines animate between a route line on the map and a demographic line graph. These are magic polylines.
воскресенье, мая 15, 2016
Maps of the Week
This week I was impressed with two story maps - one exploring the geological formation & history of North America and the other the importance of the Lancaster Sound area to wildlife and the Inuit people.
Making North America is a PBS Nova documentary film exploring the history of the geological formation of North America and how the continent's land and mountains have emerged and evolved over time.
You can now also learn more about North America, its formation and its evolution, on the PBS Nova Making North America map. Using the map you can view satellite imagery of some of North America's most distinctive geological sites and view multi-media content explaining the origins of these features during Earth's long history. Be sure to click on the flying satellite on the map to view a great tour of how some of the United States' greatest geological features were originally formed.
Tallurutiup Tariunga, otherwise known as Lancaster Sound, is the southern point of the Last Ice Area, the only area of the Arctic which is expected to retain its summer sea ice until 2050.
The World Wildlife Fund has released an interactive map of Lancaster Sound in order to raise awareness of the area's delicate ecosystem and to promote a campaign to designate the Lancaster Sound a National Marine Conservation Area. The map includes a wealth of information about the importance of the area to both wildlife and the Inuit people.
If you scroll through the 'Story' section of the map you can learn about the Sound's polar bears, whales, migratory birds and other wildlife. The 'Gallery' section allows you to watch videos of the wildlife and the area's environment. Finally the 'Explore' section of the map explains how the Inuit and local wildlife co-exist and how development could place the whole area at risk.
The Berliner Morgenpost has analysed hundreds of satellite images in order to determine Germany's greenest towns. These are Germany's Greenest Towns ranks Germany's 79 major cities in order of how much vegetation they have.
Most previous analysis of Germany's greenest cities has been determined by the amount of public parks and public recreational areas a city has, The Berliner Morgenpost has used detailed analysis of satellite imagery to provide a more accurate picture of the amount of vegetation in each city. Their analysis includes other natural areas, such as planted roofs, private gardens, urban trees and private backyards.
To analyse the satellite imagery the Berliner Morgenpost developed this EarthEngine Script. The script examines Landsat 5, Landsat 7 and Landsat 8 satellite images, with less than five percent cloud cover, taken in the summer months of June and July 2005-2015. Using the Normalized Difference Vegetation Index the Berliner Morgenpost was able to determine how much greenery was present in each 30 by 30 meter square in the imagery.
Подписаться на:
Сообщения (Atom)