пятница, июня 30, 2023

You Don't Know Africa

Let's face it your geographical knowledge of African countries is woefully inadequate. If you had to identify the location of Burkina Faso on a map you would probably end up pointing to the Philippines. 

Well it's time to change that. Today you are going to improve your knowledge of Africa and have fun while doing so. You Don't Know Africa is a collection of three online map games which will improve your geographical knowledge of African countries. 

The 'Original' game involves you having to identify the location of 20 African countries on a map in as quick a time as possible. When you identify the wrong country the correct country is highlighted on the map (all you have to do is remember where it is - because you will be asked again!).

The 'Sequel' requires you to name 20 African countries in 2 minutes. The more countries that you can type in 120 seconds then the more points you will score. If you think you can name all the African countries then you can play a ten minute version of the game instead. 

 The '3rd Edition' game involves correctly identifying the flags of 20 African countries as fast as you can (and admit it - your knowledge of African flags is as bad as your geographical knowledge of Africa).

'You Don't Know Africa' is adapted from the popular map game Click That 'Hood.

Click that 'hood! is a geography game which tests your knowledge of city neighborhoods. To play Click that 'hood! you first need to select a city or town from the very long list of locations available around the world. You are then shown an interactive map of your chosen city. Your task is to correctly identify the location of twenty neighborhoods as quickly as possible by pointing them out on the map.

You can find many more map and geography games using the games tag on Maps Mania.

четверг, июня 29, 2023

The True Size of Climate Change

This week the World Resources Institute (WRI) and the University of Maryland announced that 4.1m hectares of primary rainforest was destroyed around the world in 2022. In reporting this news many media outlets compared the amount of rainforest lost last year as being equivalent to the size of Switzerland. 

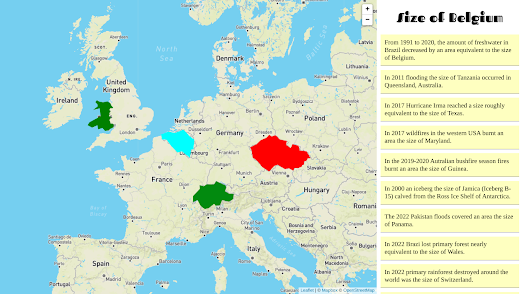
This got me thinking about how often the scale of natural disasters (such as hurricanes and wildfires) are explained by being compared to the size of countries or to other well known geographical regions. This in turn led me to the idea of creating an interactive map which uses drag-able country polygons to show the size of some well known climactic events and natural disasters.

Fans of The True Size Of ... will know all about dragging country shaped polygons around on an interactive map to compare country sizes. The True Size Of map allows users to drag and drop countries around on a map to compare the relative sizes of different countries. It can also be used to see how large an area of rainforest was destroyed last year - simply by dragging around the polygon of Switzerland on the map.

You can now also use my Size of Belgium interactive map to explore the size of a number of recent(ish) natural disasters and climactic events. For example last year's Pakistan floods were widely reported to have been 'about the size of Panama'. Using the Size of Belgium interactive map you can drag a Panama sized polygon around on the map to see how large an area this flooding event would have covered if it had happened in your home town.

The Size of Belgium also includes drag-able polygons showing the size of various recent hurricanes, icebergs and wildfires (including the recent wildfires in Canada).

I created the map with the help of webkid's amazing Leaflet Truesize plugin for Leaflet.js. If you don't want to go to the trouble of creating your own map then you can always just clone the Size of Belgium map on its Glitch page.

среда, июня 28, 2023

The 2023 Best Cities for Cycling

According to PeopleForBikes Minneapolis is the best large U.S. for cycling. 

Every year PeopleForBikes ranks the best places to cycle in the United States. This year, using its own 'Bicycle Network Analysis' (BNA) PeopleForBikes rated the quality of the cycling networks in 1,484 U.S. cities. This year Minneapolis made significant improvements to its cycling infrastructure becoming the best large city overall for cyclists.

PeopleForBikes' 2023 Best Places to Bike provides an overview of this year’s Bicycle Network Analysis ratings, highlighting the top ranked U.S. cities and the U.S. cities which made the biggest improvements to their biking networks.

San Francisco and Seattle, respectively, were the 2nd and 3rd ranked best cities for cycling. However Provincetown, Massachusetts ranked as the best city overall for cycling, with a BNA score of 88 (compared to Minneapolis's score of 68).

You can read more about how the Bicycle Network Analysis scores are calculated on the PlacesForBikes Methodology page. This methodology assesses how well a cycling network connects people to the places that they want to go and to the levels of stress that they experience while on their bikes.

You can explore your city's BNA ratings on the PeopleForBikes Place Search map. This allows you to view an interactive map of your own city, with city streets colored to show how stressful they are for cycling. As well as the 1,484 U.S. cities you can also find interactive maps ranking the cycling networks of 249 international cities, including Amsterdam (82 BNA score), Paris (83 BNA score) and Barcelona (74 BNA score).

вторник, июня 27, 2023

The End of the Rainforest

Last year we destroyed an area of rainforest equivalent to the size of Switzerland. According to a new report by the World Resources Institute (WRI) and the University of Maryland 4.1m hectares of primary rainforest was chopped down in 2022. This was a 10% increase on the previous year.

According to the report the two countries with the most tropical forest, Brazil and the Democratic Republic of the Congo, continued to increase their levels of deforestation. Primary forest loss also increased significantly in other nations like Ghana and Bolivia.

The Financial Times has created an animated map which visualizes cumulative tree cover loss in Brazil since 2001. The animated map in Tropical forest loss increased by 10% in 2022 shows how Brazil destroys rainforest equivalent to the size of Belgium every single year.

Brazil destroys by far the most rainforest every year of any country. However when you add in the primary forest destroyed in other countries around the world the the amount of rainforest lost last year was equivalent to the size of the whole of Switzerland.

If you want a sense of how much rainforest this is then you can use my Size of Switzerland interactive map to overlay the shape of Switzerland on any other country in the world. This map was created with the help of webkid's amazing Leaflet Truesize plugin for Leaflet.js.

Geoengineering Planet Earth

The Geoengineering Map shows the locations of over 1,700 geoengineering experiments taking place around the world. The mapped projects include experiments involving weather modification, carbon capture, and solar radiation management.

In response to global heating some governments and companies have proposed tackling climate change through large-scale manipulations of Earth's ecology. The Geoengineering Map created by by ETC Group and the Heinrich Boell Foundation refers to the "alarming expansion of geoengineering research and experimentation", so it is probably safe to assume that they don't support the use of geoengineering as a response to climate change. 

Despite this skepticism towards geoengineering I think that the projects are presented on the map in an objective and impartial manner. If you click on a project's marker then you can read a description of the project's aims, its ongoing status and who is backing the project. Under these details you can also read a summary of the geoengineering technology involved. For example if the selected project is attempting to capture carbon then the technology of carbon capture and storage is described under the project's details. 

On the map the different types of geoengineering projects are color-coded by type (weather modification, carbon capture or solar radiation management). The map sidebar includes buttons which allow you to filter the projects displayed on the map by type. The map also includes a date control which allows you to filter the projects shown by period (2000-2023)

понедельник, июня 26, 2023

Where Do Refugees Go?

Last year 35.5 million people (equivalent to over half the population of the UK) were forced to flee their homes and find refuge elsewhere. For World Refugee Day Al Jazeera took a closer look at where refugees come from and where they go. 

Visualizing the Global Flow of 35 Million Refugees is illustrated with two interactive maps: one showing the countries where refugees originated from last year, and the other showing the countries where refugees settled. Both maps are simple and effective, using proportional circles to show the number of refugees fleeing or entering each country and linear annotations to highlight the six countries most affected.

Where do refugees come from?

According to the UN data used for Al Jazeera's 'Where do refugees come from?' map Syria, Palestine, Ukraine, Afghanistan, Venezuela and South Sudan were the six countries where the most people were forced to leave their homes in 2022. 

In recent years in many so called 'first world' countries immigration has become a key issue, with right-wing 'populist' politicians attempting to use immigration as a handy scapegoat for falling living standards. Al Jazeera's map showing where refugees settle clearly shows that 'first world' countries, far from being swamped by refugees, are in fact mostly shirking any responsibility for housing the world's displaced and dispossessed.

Where do refugees settle?

Al Jazeera's map shows that America took in about 1/7th on the number of refugees housed by Colombia last year. In fact in 2022 the USA accepted less refugees than Colombia, Peru, Chile and Ecuador. Globally Turkey, Jordan and Iran were the three countries who took in the most refugees in 2022.

Some in the West might argue that it is not their responsibility to shelter the world's huddled masses. In fact you don't have to be much of a political historian to realize that from Palestine to Syria the geopolitical activities of 'first world' countries have played significant contributions to the displacement of innocent people from their homes, forcing them to become refugees. 

суббота, июня 24, 2023

Discovering the Dissolution

I live near Abbey Road in East London. The road is named for Langthorne Abbey, which used to be one of the largest Cistercian abbeys in England. At the beginning of the 16th Century the abbey owned most of the land in East London. It also owned a number of local mills and controlled a number of local industries including brewing, shearing, weaving, tannery and farming. Then came the Dissolution.

Between 1536-1541 Henry VIII closed down monasteries, priories, convents, and friaries in England, Wales, and Ireland. He stole their income and disposed of their assets. The land of Langthorne Abbey was granted to Sir Peter Meautas (a follower of Thomas Cromwell) and his wife Lady Jane Meautas, who then became two of the largest land owners in what is now East London. 

This appropriation of Catholic land and assets took place across the whole of England, Wales and Ireland. You can learn more about Henry VIII's break from Rome and all the monasteries and abbeys seized by the crown in the National Archives Education Service's Discover the Dissolution. This introduction to the Dissolution has been published to help schools and history groups learn more about their local history. 

Using the resources in Discover the Dissolution users can find their nearest local monastery or nunnery and learn more about the history of these local religious sites. The resource includes a number of interactive maps which show the locations of all the monasteries, priories, convents, and friaries which were closed by Henry VIII. 

You can use these maps to view the closed monasteries by year of dissolution, by religious order and by the gender of the occupants of the religious houses. Another map allows you to view the annual income of each monastery in 1534, as recorded in Henry's Valor Ecclesiasticus audit of religious houses. 

In 1534 the annual income of Langthorne Abbey was recorded in the Valor Ecclesiasticus as £511. Using the National Archives' Currency Converter you can discover that this was roughly the equivalent of £225,492.55 in modern terms. According to the converter it was enough income to buy 408 cows or 107 horses in 1530. 

The Discover the Dissolution map calculates the combined annual income of all the catholic houses as £139,552. The Currency Converter says this is the modern equivalent of £61,581,087.90. Of course all the assets and land owned by the monasteries means that they were worth a lot more than £61.5 million to the crown. The World History Encyclopedia states that the state coffers were boosted by 1.3 million pounds (over 500 million today) through the Dissolution of the Monasteries. This could have been much more but Henry awarded some of the seized land to his favorites and sold off much of the rest cheaply to the nobility.

пятница, июня 23, 2023

The Solar Eclipse Simulator

Next year on April 8 2024 there will be total solar eclipse in the United States. The path of totality will cross Mexico, the United States, and Canada, and will be about 115 miles wide. If you are within the path of totality, you will see the Sun completely blocked out by the Moon for about two minutes. If you want to preview what the solar eclipse might look like for different locations then you can use the 2024 Solar Eclipse Simulator.

The 2024 Solar Eclipse Simulator allows you to preview how the solar eclipse will appear at any location. It is therefore a fantastic tool for planning where best to view the eclipse. Obviously it is best to view an eclipse from a location within the path of totality (the locations where the Moon's shadow will completely cover the Sun during the solar eclipse). The simulator will be particularly useful for anyone who can't travel to a location within the path of totality and is curious as to what a partial eclipse might look like from a particular location.

Just click anywhere on the provided interactive map to view a simulation from that location. Once the simulation loads you can then use the playback controls to watch your solar eclipse simulation. These controls allow you to adjust the speed of the simulation and to choose whether to view the position of the stars and Baily's Beads (beads of sunlight that appear around the edge of the moon during an eclipse) during the simulation of the eclipse.

четверг, июня 22, 2023

A Year of Wildfires

NASA has released an animated map which shows the locations of active fires around the world over the last one and half years. The map Active Fires As Observed by VIIRS, 2022-Present uses observations from the Visible Infrared Imaging Radiometer Suite (VIIRS) to show the locations of active fires on Earth for every day from Jan 5th 2022 to 21st June 2023.

VIIRS uses instruments on polar-orbiting satellites to observe and record visible light and infrared radiation on Earth. Fires release light in the form of infrared radiation and visible light. VIIRS can measure the intensity the location and intensity of this light to detect the location of fires on Earth.

You can explore NASA's animated video map by using the videos controls. For example if you pause the video anywhere in June of this year you can see the cluster of fires in Quebec and Nova Scotia which recently caused high levels of air pollution in eastern Canada and the northeastern United States.

NASA's map also superbly visualizes the occurrence of fire seasons around the world, for example the active wildfire seasons in Central and Southern Africa. The Sahel region in Central Africa, has its dry season in December to March. You can see on the map that the number of fires in Central Africa increases drastically during this dry season. The dry season in Southern Africa occurs later (roughly April through Oct). Again the NASA map shows that the number of wildfires in Southern Africa grows dramatically in these months.

You can also watch animations of VIIRS active fires observations on the Global Forest Watch's interactive map. The Interactive World Forest Map includes a VIIRS layer which allows you to view active fires around the world for any selected date range.

The Forest Fires section of Global Forest Watch acknowledges that fire seasons (as seen in Central and Southern Africa) are a natural occurrence within many forest ecosystems. However it also points out that the severity and extent of wildfires are increasing because of global heating. According to Global Forest Watch hotter temperatures and therefore drier flora is leading to more "frequent, larger and higher intensity wildfires.

среда, июня 21, 2023

GeoGuessr for Video Games

Gamers can now test their gaming knowledge using a series of GeoGuessr type games based in some of the most popular video game worlds. These video game 'geoguessrs' include Grand Theft Auto, World of Warcraft, Fortnite, Minecraft, Final Fantasy and  Guild Wars.

GeoGuessr is a very popular web-based geographic discovery game in which players are randomly placed in a Google Street View location and must guess their location on a map of the world. The game uses Google Maps’ Street View technology to show players a random view of an area, and the player must use their knowledge of geography, landscape, and signs to make a guess as to the real world location. The closer the guess is to the actual location, the more points the player earns.

The following GeoGuessr type games work in exactly the same way. However instead of having to guess real world locations in these games the player has to identify locations in popular video game worlds. You are shown a panoramic 'Street View' type image of a location of your favorite game world and you must identify that location on an interactive game world map.

Lostgamer allows you to play a GeoGuessr type Street View game in a selection of your favorite game worlds. Fans of GeoGuessr will be familiar with the gameplay of Lostgamer. In GeoGuessr you are required to identify real-world locations from Google Maps Street View imagery. The gameplay in Lostgamer is exactly the same. Only in this case you have to identify where you are in a virtual game-world based on 360 panoramic imagery of that world's map. 

You can choose to play Lostgamer in three different game-worlds; Grand Theft Auto's Los Santos, World of Warcraft's Shadowlands or the Fortnite game-world. Choose either GTA, WoW or Fortnite and you will be randomly dropped in your chosen game's game-world. Using the custom made Street View imagery you then have to work out where you are in that world. If the location isn't immediately apparent you can use the arrows to move around (just as you would on Google Maps Street View). When you think you know where you are you can submit your answer by dropping a pin on the map of your game-world. You will then be awarded points based on how close you guessed to the correct location.

Lostgamer allows you to 'play solo', where you play against yourself and attempt to set your own personal high-score. Alternatively you can play 'multiplayer', in which you get to test your knowledge of one of the three featured game-worlds against other players.  

Even if you aren't interested in playing a Geoguessr type game you can still have a lot of fun with Lostgamer. Instead of trying to work out where you have been randomly dropped in a virtual game-world you can just use Lostgamer to virtually explore Los Santos, the Shadowlands or the Fortnite world. Each game has been fully mapped using custom developed Street View like panoramas. This means that you can explore each of these three game-worlds exactly as you might explore your own town using Google Maps Street View.

Guild Wars 2 Geo Guesser is another GeoGuessr type game which allows you to test your knowledge of the vast fantasy world of Tyria. 

Unfortunately, unlike the other games featured in this post, Guild Wars 2 Geo Guesser doesn't have panoramic imagery and instead works from static screenshots of Tyria. However in all other aspects Guild Wars 2 Geo Guesser is a great application of the GeoGuessr form of location guessing game applied to the Tyria game-world. In each round of the game you are shown a succession of images showing locations in Tyria and you have to identify the location depicted by selecting it on an interactive map of the game. You are then awarded points based on how close you are to the real location.

Hermitcraft GeoGuessr is a GueGuessr type game which requires you to identify locations in the Minecraft worlds of Hermitcraft.

Hermitcraft is a popular Minecraft server on which Minecraft players, known as Hermits, create and share Minecraft creations based on various themes and challenges. In Hermitcraft Geoguessr you are shown a random panoramic 'Street View' image of a location in the Hermitcraft Minecraft world. You then have to guess the location of that Street View by clicking on an interactive map. Points, as always, are awarded based on how close you are to the depicted location.

Eorguessr is a geographic discovery game which requires you to identify your location in the universe of Final Fantasy XIV. Final Fantasy XIV is a massively multiplayer online role-playing game set in the fictional world of Eorzea.

In Eorguessr you can choose from a selection of expansion packs to choose which parts of Eorzea (or which expansion pack game-world) you wish to play in. After selecting your expansion packs you are then shown a series of panoramic Street View images of Eorzea. Each of which you have to identify by clicking on an Eorzea interactive map.

вторник, июня 20, 2023

The Kessler Syndrome

Steve Wozniak and a host of other Silicon Valley luminaries have launched a new company called Privateer, whose mission is to track and map space debris in Earth's orbit.

In 1978 NASA scientist Donald J. Kessler published a paper which argued that if the number of satellites in Low Earth Orbit reached a certain critical level, then even a small collision could create enough debris to cause a chain reaction that would eventually make further space exploration impossible. What has come to be known as the 'Kessler Syndrome' (or 'Kessler Effect') is the estimation that a critical level of space debris will eventually make it impossible to launch new satellites or spacecraft into LEO, as they would be at risk of being damaged or destroyed by the debris.

Steve Wozniak's Privateer Space company has therefore launched an interactive map which maps and visualizes Earth's orbital debris problem. Wayfinder is an interactive map which shows the location of space junk and Earth satellites in near real-time.

Wayfinder joins an ever growing list of space debris maps. A list which includes What Goes Up, the University of Texas' interactive AstriaGraph, and Esri's SatelliteXplorer. Wayfinder's USP in this already crowded market is its 'Crow's Nest' feature. Crow’s Nest is a collision risk assessment tool. Open the Crow's Nest menu in Wayfinder and you can view a list of upcoming possible space debris collisions. 

The Crow's Nest list of possible collisions are calculated using NASA's CARA (Conjunction Assessment Risk Analysis). CARA assesses the risk of collisions between satellites and/or space debris using orbital satellite tracking data, satellite catalog data, and collision probability models. The Crow's Nest list of possible future collisions allows you to zoom in on a time and space where and when a collision might take place, view which objects could be involved and view the probability scores of each possible collision.

You can learn more about the dangers of ever increasing amounts of space debris in Low Earth Orbit in the Financial Times' story map How Space Debris Threatens Modern Life. In this map the Financial Times explores the growing problem of space pollution to life on Earth. 

According to NASA there are around 9,000 tonnes of debris now floating around Earth at speeds of up to 25,000 km an hour. In this scrollytelling visualization the Financial Times maps out the tens of thousands of satellites now in low Earth orbit and visualizes some of the dangers to modern life from the increasing amount of junk accompanying those still active satellites.

понедельник, июня 19, 2023

Staring at the Moon

NASA's Daily Moon Guide is a new interactive map to help you observe the moon on any day of the year. The map shows you what you can see on the moon today with the unaided eye, with binoculars or with a telescope, taking into account the current phase of the moon.

The Daily Moon Guide automatically shows you the current phase of the moon. So, for example, tonight you won't see much of the moon because we had a new moon yesterday. However what you will see if you look up at tonight's waxing crescent moon is shown by the Daily Moon Guide. The moon guide also includes a date control which allows you to view the phase of the moon for any future or past date.

The Daily Moon Guide includes a hemisphere control which allows you to select what you will see from the northern or southern hemispheres. One of the main features of the Daily Moon Guide is that it includes point-of-interest labels which show you what you can see on the moon with the naked eye, with binoculars or with a telescope. For example on Wednesday, with the naked eye, you should be able to see the Mare Crisium and the Mare Fecunditatis.

суббота, июня 17, 2023

AI Street View Hallucinations

I have been a huge admirer of OpenStreetMap Haiku for a number of years. OpenStreetMap Haiku is a clever map that can write a short poem about any location in the world based on the OpenStreetMap data for that location. 

Share your location with OpenStreetMap Haiku and it will generate a unique haiku using data gleaned from OpenStreetMap using Overpass Turbo. I thought that it might be interesting to use the same process to create AI Street View images of locations based purely on the OpenStreetMap data for that location. Luckily for me the blog post OpenStreetMap Haiku: Using OSM and Overpass for generative poetry does a very good job of explaining how to frame an Overpass Turbo query to retrieve all the OSM data in a radius around a specified location.

If you are very clever and rich you could create an interactive map which could create an AI generated image for any clicked on location by using the Overpass Turbo AI and feeding the resulting data as a prompt into Midjourney or DALL·E 2.

I'm neither rich nor clever. I can't afford to make thousands of queries to an AI image generator. So instead of making a map like OpenStreetMap Haiku for AI Street View I decided instead to just manually enter a few prompts (based on Overpass Turbo queries for specific locations) into Bing's free Image Creator.

Here are my first AI generated Street View hallucinations generated by Bing's Image Creator using prompts from Overpass Turbo queries:
 
West 23rd Street & 8th Avenue, New York, NY, USA

Google Street View (left) and Bing Image Creator (right)


In Crissy Field, San Francisco looking at the Golden Gate Bridge

Google Street View (left) and Bing Image Creator (right)


On Westminster Bridge, London looking at Big Ben and the Houses of Parliament

Google Street View (left) and Bing Image Creator (right)

After attempting only a handful of AI Street View hallucinations I can report that it is easier to create more accurate images for very well known locations than it is for lesser known backstreet locations. Presumably this is because DALL-E (which Bing Image Creator uses) has a huge pool of training images for the most well-known and most photographed locations. 

The New York AI Street View above was created using the prompt "A road junction in New York with traffic signals. A subway entrance. A Starbucks coffee shop". This prompt was compiled using OSM data extracted from Overpass Turbo for West 23rd Street & 8th Avenue. In generating the AI image from this prompt Bing Image Creator is creating a kind of generic New York road junction based on its training images. The AI image has only a passing resemblance to the real junction at West 23rd Street & 8th Avenue. The generated Street View images for Westminster Bridge and the Golden Gate Bridge are, as you might expect, much more accurate than the image generated for a random New York junction.

пятница, июня 16, 2023

The History of Latin America

The Latin American Political History Map is an animated map which attempts to visualize the ever changing history of Latin American politics, by revealing the political leanings of Latin American countries (and the USA) over the course of over 200 years.

I've been following the heated debate on Twitter around this map with some interest this morning. Many of the perceived problems with the map seem to center around the subjective definitions of countries' political leanings. There seem to be a lot of disagreements with the map's choices about the defined left or right wing leanings of countries at different times in their histories. There also seem to be a few questions as to why some military dictatorships have avoided being colored as 'military Non-Aligned'.

Border changes in South America 1783-1994, according to Historic Borders

What doesn't seem to have been mentioned so far on Twitter are the country borders. According to the Latin American History Map all the country borders on the American continent were agreed upon sometime before 1789 and they haven't changed since. 

The map's starting point of 1789 goes some way to explain some of the problems with this map. The fact that the American Revolution was chosen as a starting point for a history of Latin American politics may hint at the perspective of this map. 

What I like most about this map is the 'Events' sidebar which provides some historical context to the politics of Latin America. This timeline covers some of the most important historical political events in the last two hundred years of American history. The timeline is synched to the map, so, if you click on an event in the timeline, the countries mentioned/effected by an event are highlighted on the actual map.

If you are interested in how Latin American country borders have changed during the last 200 years then you might find this Historical Country Borders post useful, as it links to a number of history maps which attempt to show country borders changing over time.

Caleb Lovell has addressed many of the concerns raised about his map on his blog post Building Latamap. In this post he directly addresses the fact that 'political affiliation is an ever-changing, hotly debated topic' and explains the difficulties he faced in deciding on the political affiliations of country leaders. Lovell explains that it is often difficult to assign a leader to just one category. For example Augusto Pinochet was clearly a military dictator but was also clearly on the far-right of the political spectrum. Lovell chose to categorise Pinochet as far-right on his map. This doesn't mean that Pinochet wasn't a military dictator. 

четверг, июня 15, 2023

AI Map Search

I am trying to keep track of developments in the use of artificial intelligence in mapping. At the moment the most interesting experiments seem to involve using AI to help answer geospatial queries. This is leading to some interesting maps which use AI to map answers to users' queries. 

Over the last few months I've been reading with interest on Twitter how developers have been using AI models (mainly ChatGPT) to create Overpass Turbo queries, to display requested OSM features on an interactive map, and to help make ChatGPT Generated Web Maps

A few developers have already released working interactive maps which make use of AI to generate maps based on queries or prompts.

Trident

I know very little about Trident beyond that it bills itself as an "interactive Smart Maps assistant" and that it generates maps based on OpenStreetMap data. This means that Trident is quite good at finding pubs in London or cafes in New York City but can't respond to queries such as 'Show me the four largest mountains in the world". 

I have also had little success searching Trident using distance requests (for example 'show me cafes within 200 yards of subway stations in NYC'). Despite these limitations to the type of queries that Trident appears able to respond to it does seem to produce the most complete responses to point-of-interest type queries. This is because it makes use of OpenStreetMap's huge repository of geographical data.


Texttomap uses ChatGPT to generate maps from user prompts. This means that Texttomap can be very good at answering geographical questions such as 'what are the four longest rivers in America?' and showing the results on a map. 

Texttomap can also map queries such as 'show me pubs in Westminster, London'. However Texttomap doesn't appear to use OpenStreetMap data to generate results. I have therefore found Texttomap results for point-of-interest type queries less complete than those generated by Trident. However it does appear to be very good at answering and mapping geographical queries such as 'What are the ten biggest mountains in the world?"

 
MapsGPT uses OpenAI to answer geographical questions. It requires users to enter a two part prompt to generate a map of searched places in a defined area. For example you could use MapsGPT to find kid-friendly activities in San Francsico. MapsGPT will then e-mail you a link to a generated interactive map. For example here is the map MapsGPT generated for me when I requested restaurants near Spitalfield's London

Like Texttomap MapsGPT uses an AI to find specific points of interest rather than OpenStreetMap data. Again I suspect that if you want to find a type of point-of-interest within a defined area that you will get more detailed and more complete results using Trident instead.

среда, июня 14, 2023

The June Deportations

In 1939 the Soviet Union entered into a non-aggression pact with Nazi Germany. In addition to the agreement to not attack each over the Molotov-Ribbentrop Pact included the Secret Protocol. In this protocol Germany and the Soviet Union effectively divided up Europe among themselves, deciding which countries they would allow the other to invade.

Soon after the signing of the Molotov-Ribbentrop pact both Germany and the Soviet Union invaded Poland and the Soviet Union annexed Estonia, Latvia, Lithuania and parts of Romania. A year after the occupation and annexation of the Baltic states the Soviet Union began deporting on mass people deemed 'anti-Soviet' from Estonia, Latvia, Lithuania, occupied Poland and Moldavia. The 'June Deportation' saw tens of thousands of citizens arrested and deported from the Baltic States to the Gulag or to other inhospitable Soviet regions. 
 

The interactive map Deportēto karte shows the home addresses of the thousands of Latvians deported by the Soviet Union on 14 June 1941 and in March 1949. Zooming in on a city, such as the capital Riga, on the map reveals the horrendous scale of the Soviet deportations, with hardly a street or neighborhood block unaffected by the deportations.

If you live in Latvia you can see which of the homes in your street had people forcibly removed and deported. You can even click on the individual map markers to reveal the names and ages of the people deported in your street. In total around 60,000 inhabitants of Latvia were deported by the Soviet Union.

вторник, июня 13, 2023

Chronotube

NYC Subwaysheds visualizes how far you can get in "40 minutes from each subway station in New York City". Hover over a subway station on this map and an isochrone layer shows the accessible areas around that station in ten minute intervals (traveling by subway and by foot).

Mapbox's Chris Whong was inspired to make the map by the ever popular Chronotrains map. Chronotrains visualizes the travel times between different cities in Europe by train. It shows how far you can travel by train in 8 hours from every European train station. 

You might also like Chronotrains 1911, which uses train travel-times from 1911 to show you how far you could travel by train in five hours from any French station in the second decade of the 20th Century. The data for the 1911 map comes from Cambridge University's Communes project, which has digitised the French rail network from 1832 to 2015.

You can find even more public transit travel time maps using the isochrone label on Maps Mania.

Where You Can't Afford to Live

The Guardian has published an interactive map which visualizes where you can't afford to live or rent in the UK. Unfortunately the newspaper has mistakenly mistitled the map Find out where you can afford to buy or rent in Great Britain rather than the presumably intended 'Find out where you can't afford to buy or rent in Great Britain'.

The Guardian map allows you to enter your annual salary to discover all the locations where you might be able to afford to rent or buy a property. The screenshot at the top of this post shows all the locations (in red) where you cannot afford to buy or rent on the average UK salary of £31,772. As you can see from the map if you earn at or below the UK average salary then you might be able to afford to live in a few towns in the northeast of England or in parts of Scotland. However housing in the vast majority of the UK is way beyond your dreams.

Once you have entered your annual salary you can also click on postcode areas on the map to find out more about the affordability of property in that area. For example if I click on my London postcode (one of the cheapest places to buy in London) it says that the median property price is £400,000 - which The Guardian says is 11.3 times the annual income (although my calculations make the real figure 12.59 times the UK average salary). 

Most mortgages in the UK are agreed on at 4-4.5 times the average salary. So even if you are a couple who are both earning the equivalent of the UK average salary your combined earnings would still not be enough to buy a property in one of London's poorest boroughs.

понедельник, июня 12, 2023

The Map of Roman Amphitheaters

Roman Amphitheaters is an interactive map of Roman amphitheaters built in Europe and northern Africa during the long reign of the Roman Empire. The map has been created using Sebastian Heath's Roman amphitheaters data.

The amphitheater markers on the map are sized by capacity. Select an amphitheater on the map and an information window opens providing details on the amphitheaters's capacity, construction date and also a link to view the amphitheater's entry on Pleiades. You can also view an aerial imagery of the selected amphitheater on the provided satellite map (obviously many Roman amphitheaters no longer exist). 

Pleiades is an online gazetteer of ancient places. The gazetteer provides information on more than 34,000 ancient places around the world. Because Pleiades is open data the content is freely available to anyone who wants to use it - for example to create a map of Roman Amphitheatres.

If you want to better understand the life of a traveling gladiator in ancient Rome then you can use the OmnesViae: Roman Routeplanner map to work out how long it would take to travel between any two amphtheaters on the Roman Amphitheaters map. Omnes Viae: Itinerarium Romanum is a route planner that lets you navigate the Roman Empire using the roads and shipping lanes available to the ancient Romans.

Omnes Viae is based on an ancient Roman map known as the 'Tabula Peutingeriana' and allows you to plan a route that contains all the main roads and cities of the Roman Empire. You could therefore use the map, for example, to plan a route between Rome and the amphitheatre in Lecce. Depending on your strength and fighting skills you might not need the directions back. 

суббота, июня 10, 2023

Global Sunlight Chart

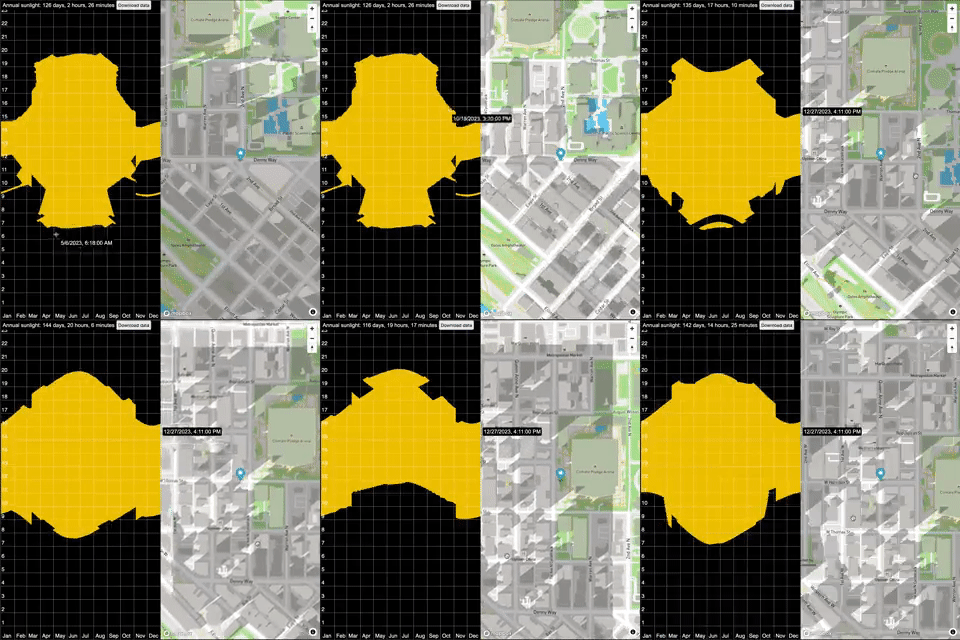
The ShadeMap: Direct Sunlight Chart is an interactive map which can calculate the number of hours of direct sunlight for any location on Earth. Unlike traditional sun charts, this map actually accounts for shadows cast by buildings and terrain. If a tall building or mountain blocks out the sun for part of the day this is taken into account in the sunlight chart for that location.

The Shademap: Direct Sunlight Chart is a great way to visualize how the latitude of a location affects the number of hours of sunlight it receives. Locations close to the equator have little variation in the daily number of hours of sunlight. The farther a location is from the equator then the larger the seasonal variation in the daily hours of sunlight. 
In the image above you can see that the number of daily hours of sunshine in Ecuador, near the equator (shown on the left), remains fairly constant throughout the year. However Reykjavik, Iceland (shown on the right) has hardly any hours of sunlight in the winter months. Conversely on and near the summer solstice Reykjavik has almost 20 hours of daylight every day.

Of course the number of hours of sunlight you receive can also be affected by tall buildings and your local terrain. If you live in a valley or near a tall building then the sun may be obscured for part of the day. The animated GIF at the top of this post shows how near-by locations in the same city can have a huge difference in the number of daily hours of sunlight received, due to the presence of tall buildings. If you are thinking of moving home then you might want to bookmark this map in order to check how the local terrain or nearby tall buildings may affect the hours of sunlight received by any potential new home. 

пятница, июня 09, 2023

America's Pink Migration Banana

The San Francisco Chronicle has published a fascinating map which visualizes net migration in US counties. On this map counties which have seen a net loss in migration are shown in pink and those that have seen a net gain are shown in blue. The map therefore provides a great overview of where Americans are moving to and from.

The Where People are Moving map reveals a pink banana running down the center of the United States. The majority of counties in North and South Dakota, in Nebraska, Kansas, western Oklahoma, and western Texas have seen a net loss in migration. Which means that more people are leaving these areas than are moving in (this isn't true in eastern Oklahoma and eastern Texas, where the majority of counties have seen a net gain in migration). 

Maine appears to be one of the states in America where residents have no desire to leave. Only one county in the state on the Chronicle's map shows a net loss in migration. Every other county in the state showed a net gain in migration. Florida is another state which has a large majority of counties showing a net gain in migration. It is the only state where I would take a stab at guessing the reasons behind its current migration trend - namely it is a popular place for retirement for the baby boomer generation.

The Chronicle's accompanying article is concerned mainly with the 'urban exodus' (particularly from San Francisco). They see the map as showing that people are migrating out of cities to the suburbs in response to the Covid panademic. The Chronicle's map isn't a great visualization of this pattern as it shows migration loss and gains at the county level. The Chronicle could have added city boundaries to the map to more clearly reveal the migration gains and losses in cities.

The data for the map comes from the Internal Revenue Service, which records changes of addresses on people's tax returns. The "data is based on the reported mailing address on tax returns filed to the IRS for the 2020-21 tax year" and the map shows net migration loss and gains between 2020 and 2021.

четверг, июня 08, 2023

The Privatisation of East Germany

After the reunification of Germany in 1990 the German Democratic Republic established an agency in order to privatise East German enterprises. The Treuhandanstalt (Trust Institution) was tasked with overseeing the sale of over 8,500 state-owned companies.

Under communism nearly half of all East Germans worked for the state or for state-run companies. Privatising all East German enterprises would obviously have huge consequences not only for the enterprises themselves but for the whole population of the former East Germany. 

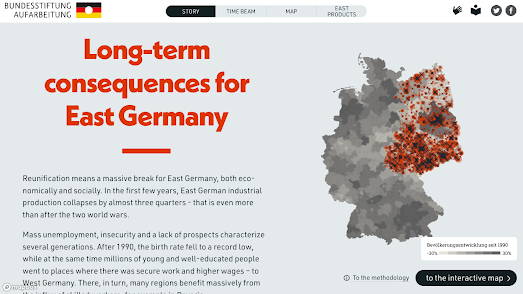
The Federal Foundation for the Reappraisal of the SED Dictatorship is tasked by the German government to help assess the history of the German Democratic Republic and its impact on the now reunified Germany. Die Treuhand und die Folgen is an interactive created by the foundation which tells the story of the Trust Institution and the consequences of the rapid privatisation of East German enterprises on those enterprises and their employees.

An interactive map plays a large role in Die Treuhand und die Folgen. The map shows the locations of GDR enterprises pre-reunification. If you click on a company's marker on the map you can view the number of people it employed in 1990, and its current status. 

According to the foundation some of the consequences of the Treuhandstalt were "Mass unemployment, insecurity and a lack of prospects (for) several generations". The foundation claims that many East Germans view the mass privatisation of East German enterprises as a 'negative' experience which was badly managed by West Germany. 

среда, июня 07, 2023

Wildfires & Smoke Pollution

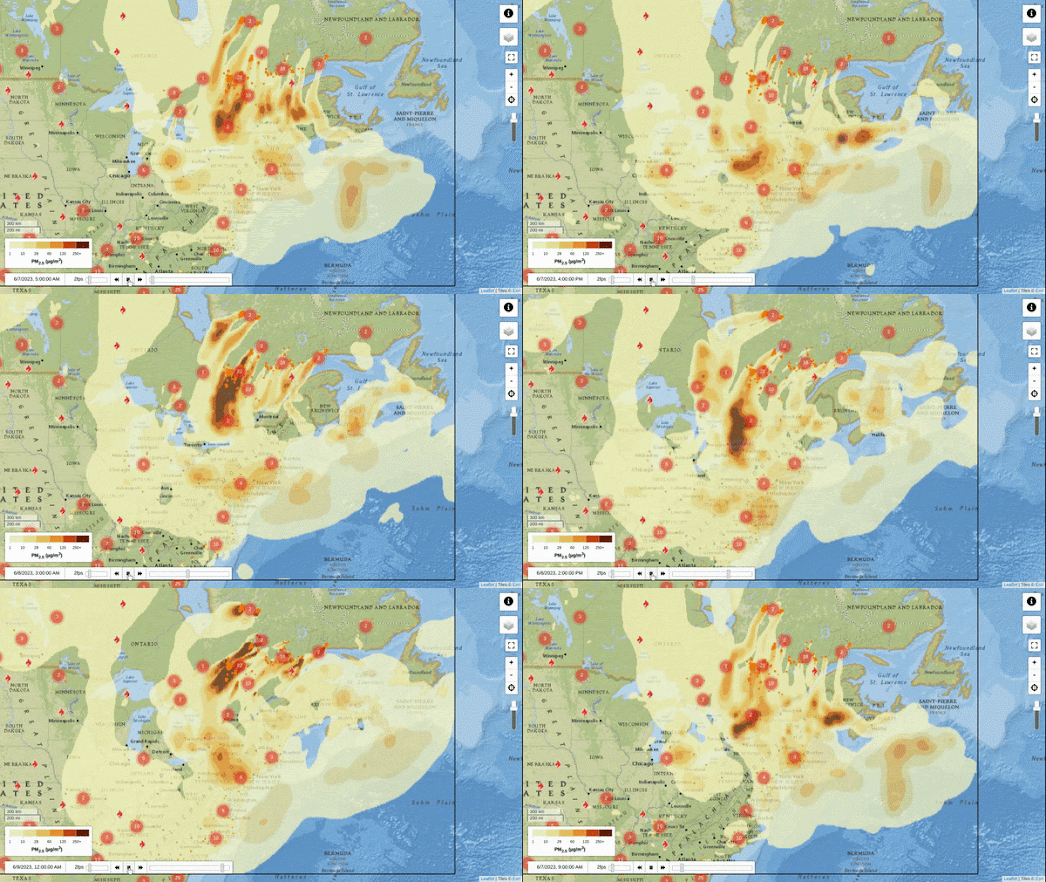
Wildfires in Quebec and Nova Scotia are causing high levels of unhealthy air conditions across much of eastern Canada and the northeastern United States. Over 400 fires were reported to be burning in Canada on Tuesday evening resulting in smoke pollution and dangerous levels of particulate matter 2.5 over large areas.

FireSmoke Canada has an interactive smoke forecast map which provides forecasts for the next few days. The current forecast shows that a large area of eastern Canada and the northeastern U.S. should expect dangerous levels of PM2 at times over the course of this week.

FireSmoke Canada forecasts are produced by the BlueSky Canada smoke modelling system, which is an ongoing research project at the University of British Columbia. The system uses satellite detections to locate fires, weather forecasts to predict how the smoke will move, and a dispersion model to calculate how smoke will be distributed in the atmosphere. The forecasts are updated every 6 hours and show the expected concentration of PM2.5, a type of particulate matter that can be harmful to human health, at ground level from wildfires.

AirNow's Fire and Smoke Map shows the Air Quality Index (AQI) levels across the United States and Canada. It allows you to view the current particle pollution air quality at your location. It can also give you information about fires and smoke plumes. The map currently shows high levels of air pollution in much of the state of New York. You can view AirNow's air quality forecasts for the next two days in New York regions on their New York air quality forecast page.

вторник, июня 06, 2023

Quiz Around the World

How well do you know the world? Let's find out with Szilvia Berczes' map it! game.

The premise of map it! is very simple. All you have to do is point to the location of ten named countries on a 3D globe. To make the game even easier you can choose which region of the world you wish to play in (Europe, Americas, Asia or Africa). You are awarded one point for every country you identify correctly, with a maximum of ten points. If you click on the star icon at the top of the map you can view your high scores for each of the regions that you have played so far.

The game was made with React.js and the Mapbox mapping library. You can learn more about how the game was made on map it's GitHub repository.

You can find and play many more map and geography games using the games tag on Maps Mania.

понедельник, июня 05, 2023

Assassination Simulation

Japanese broadcaster MBS has released a full scale 3D digital recreation of the assassination of Shinzo Abe. In July 2022 the Japanese Prime Minister Shinzo Abe was shot and killed while giving a speech at Yamato-Saidaiji Station, Nara. A Re-creation of former PM Shinzo Abe's Assassination is a shocking full re-enactment of the Prime Minister's assassination, which uses witness accounts and police reports, to show how the shooting unfolded in real-time.

The use of photogrammetry to create interactive 3D models is a growing trend in journalism. The technology can be used by journalists or media graphic teams to create more immersive and engaging news stories. The creation of interactive 3D models of crime scenes, natural disasters, or other events can help journalists to better understand and explain these events to their viewers. However the accuracy of these 3D re-creations can also be disturbing because of their photo-realism. 

MBS's Re-creation of former PM Shinzo Abe's Assassination has proved controversial, with some readers arguing that it is insensitive to reenact such a violent event. MBS's reenactment allows you to view Shinzo Abe's assassination from three different perspectives; from the perspective of the killer, from the perspective of Shinzo Abe and from the air. 

You can see how showing the assassination from the perspective of the killer in particular could be very controversial. In MBS's defence the reenactment of Shinzo Abe's murder is very effective in demonstrating how the events on the ground obscured the Prime Minister's security team's view of the approaching killer. Also, whether you agree that such an accurate reenactment of a murder should ever be shown or not, the actual reenactment is an extraordinary technical achievement by MBS's graphics department. 

Other examples of 3D reenactments include:

суббота, июня 03, 2023

Where is the Cheapest McDonalds?

At the time of writing the most expensive country in which to buy a Big Mac is Switzerland, where a MacDonald's burger will set you back SFr6.70 (around $7.37). The cheapest country to buy a Big Mac, according to the Big Mac Index, is Egypt, where a burger will cost you E£55.00 (around $1.78). According to the index the average cost of a Big Mac in the USA is $5.36.

The Economist's Big Mac Index compares the purchasing power parity (PPP) between the currencies of different countries by examining the price of a Big Mac hamburger sold at McDonalds' restaurants. The Index "is based on the theory of purchasing-power parity (PPP), the notion that in the long run exchange rates should move towards the rate that would equalise the prices of an identical basket of goods and services (in this case, a burger) in any two countries". 

It can also be used to find out the price of a Big Mac in countries around the world.

The McCheapest Map by Pantry & Larder tracks and maps the cost of a Big Mac at every McDonalds in the United States. On this map every McDonalds' outlet is represented by a dot which is colored to show the cost of a Big Mac (green=cheaper and red=more expensive). 

Currently the cheapest Big Mac in the country is in Stigler, Oklahoma  ($3.49) and the most expensive is in Lee, Massachusetts ($8.09). As shown above according to the Big Mac Index the current average price for a Big Mac in the USA is $5.36. 

Obviously traveling to Stigler, Oklahoma to save a couple of dollars on a Big Mac is impractical for most people. Luckily the McCheapest Map updates to show the cheapest and most expensive McDonalds' restaurant in the current map view. Therefore you can just zoom in on your town and the map will show the cheapest and most expensive McDonalds in your area.


пятница, июня 02, 2023

Tree Maps of the World

Gieß den Kiez is an interactive map of over 800,000 trees in Berlin. Using the map Berliners can discover what types of trees are growing in their neighborhood and then sign-up to help water individual trees. 

By clicking on individual trees on the Gieß den Kiez (Water the Neighborhood) map you can get information about a tree's species, its age and its watering requirements. Registered users can also adopt individual trees and tag them when they have watered them. The information display for each tree includes a chart which shows when the tree was last watered. 

If you want to create a Water the Neighborhood for your city then you can fork the project on the Gieß den Kiez GitHub page. Something which Leipzig Gießt has successfully managed in creating a map of over 60,000 trees in Leipzig. Like the Berlin map Leipzig Gieß can be used to find out about local trees and to sign-up to help water individual trees.

Steve Bennett has created a global database and interactive map of open tree data from around the world. His OpenTrees.org map shows the location of nearly 14 million trees in over 190 cities around the globe in 19 different countries. 

Many local and municipal governments keep a record of all the trees that they are responsible for maintaining. OpenTrees.org uses this data to create a worldwide map of trees. When you select a city marker on the map you can explore an overview of the tree data kept by the city. This includes information on the number of different trees of different species and the type of data which the city records about each tree. 

The map menu allows you to change how the trees appear on the map. For example you can see all the tree markers in a city colored by species, or sized by trunk size. If you select an individual tree on the map you can view its scientific and common name. You can also view images and information on the selected species of tree (this information is taken from Wikipedia). The map also includes a link to view a selected  tree on Google Maps Street View (where available).

When you select an individual tree on the map you should also be able to find a link to the original data source. These local municipality databases have also been used to create the following city tree maps:


The New York City Street Tree Map
Melbourne Urban Forest
London Tree Map
Trees of Madison
Amsterdam Tree Map

четверг, июня 01, 2023

Mapping 1,001 American Novels

1,001 Novels: A Library of America is an interactive literary map of America. A map on which over one thousand novels have been plotted based on the geographical 'heart' of each story. 

'1,001 Novels: A Library of America' is a project of love created by Susan Straight, a novelist and professor at UC Riverside. Over the course of five years, Susan read and mapped 1,001 novels set in the United States. The resulting interactive map allows you to explore American novels by region, plot, and theme.

Straight's goal in mapping over one thousand American novels was to "tell the story of America through its literature." She believes that novels can provide a unique window into the lives of people from different parts of the country and different eras. By mapping the novels, Straight also hoped to create a tool that can help readers discover new books and learn more about the history and culture of the United States.

As a result of reading and mapping 1.001 American novels Susan developed a sense of 11 distinct regions in the United States. These regions are based on the physical geography of the United States, as well as the cultural and historical traditions of each region. In the Esri Story Map 1,001 Novels: A Library of America you can explore each of these 11 regions and the novels that are set in each region. Susan Straight believes that these regions provide a unique lens through which to view American literature. By exploring the novels set in each region, it is possible to gain a deeper understanding of the diversity of American life and culture.

The Esri Story map also includes a complete map of all 1.001 novels set across all regions of the United States. The location setting in each novel has been determined by references in the books themselves, from what authors have said and from asking some of the authors themselves where they believe the heart of their books might be.