вторник, октября 31, 2023

The Spookiest Places in the USA

The United States is a very scary country. The Scariest Place Names in the US is an interactive map which plots some of the most frightening sounding locations across America. You've probably already heard of the towns of Hell in Michigan and Tombstone, Arizona. But have you heard of Transylvania, Louisiana and Slaughter Beach, Delaware.

You can find many, many more spooky sounding locations on the Scariest Place Names in the US. On this map thousands of different scary sounding places have been identified using colored map markers. So if you zoom in on your home you should be able to quickly find the scariest sounding locations nearby.

You can find even more spooky-sounding locations to spend this Halloween on the 13 Spooky Halloween Haunts interactive map. This map plots the locations of some of America's most frightening place-names. It also explains how these particular locations earned their spooky sounding names. 

For example there is a Dead Women Crossing in Oklahoma, which was named for the headless corpse of a young schoolteacher who was found there in 1904. If that isn't scary enough for you then why not spend Halloween night at Murder Creek, Alabama, named for the party of loyalists robbed and murdered there during the Revolutionary War.

понедельник, октября 30, 2023

Halloween's Most Haunted Places

There are many haunted locations that you might want to visit (or avoid) on this All Hallows' Eve. Mashed World has released an interactive map which maps haunted locations across the world identified by the ChatGPT AI.

Haunted Locations plots 37 locations in countries around the globe. These haunted locations include the Tower of London (the site of many historical executions), Bran Castle (perhaps more commonly known as Dracula's Castle) and the White House (haunted by many suspicious characters over the years).

The UK Haunted Locations Database actually has an interactive map of over 5,000 haunted places in the UK. Zoom-in on your home on this map and you can discover the haunts of your nearest local ghosts. Mine is the ghost of the Theatre Royal, Stratford East. It is said that the theatre's creator Freddy Fredericks regularly haunts the building, checking to see that his initials are still painted on an archway (if they are removed it is said that the theatre will soon fail).

Mashed World has also used its AI Search Map tool to create a number of other Spooky Maps. These include maps created by ChatGPT showing the locations of the Scariest Places in the World, Horror Movie Filming Locations, Halloween Festivals and many more.

The Little Free Library World Map

I shall be eternally grateful to my local community's book sharing box. As an avid reader being able to borrow and read secondhand books during lock-down kept me from becoming completely stir crazy. Since lock-down my nearest book-sharing box has almost fallen into disuse. Which is why I'm delighted to have found the Little Free Library World Map.

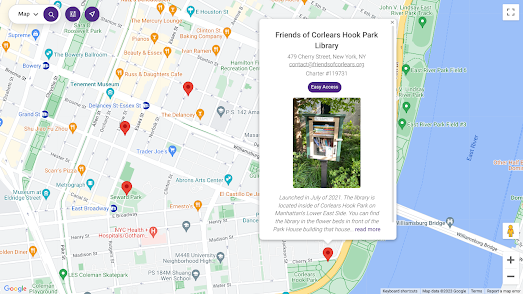
The Little Free Library World Map is an interactive map showing the locations of book-exchange boxes around the world. The map was created by the Little Free Library non-profit of Minnesota and has now mapped over 150,000 libraries in 120 different countries. 

Share your location with the Little Free Library World Map and you can find the nearest book-exchange boxes to your home. The locations of individual free libraries are displayed on the map using red map markers. If you click on a marker you can view the library's exact address and information on exactly where you can find this book-exchange box.

I'm lucky enough to have two boxes within walking distance of my home. If there are none near you there is no need to despair. Instead you can set up your very own Little Free Library. All you really need to start a free library is a weather-proof container in which people can leave books they wish to share. If you need help creating such a container then you can check out the Start a Little Free Library web page.

If you live in London or Brighton then you might also be interested in the Library of Things, which allows you to borrow/rent tools (such as drills, sewing machines etc).


суббота, октября 28, 2023

The World Map of Podcasts

MapsFM is an interactive map which can help you find and listen to podcasts produced around the world. Listening to location based podcasts could be a great way to learn more about a planned travel destination or even to learn more about your local neighborhood or town. Now you can easily find and listen to location based podcasts by using the MapsFM map of the podcast world.

Simply share your location with MapsFM or use the search option to enter an address and you can then view all the podcasts about that place marked on a local map. You can view the title of each podcast simply by hovering over a podcast's marker on the map. Click on the marker and you can then listen to the selected podcast directly from the map sidebar. 

For some reason all the podcasts about my area of East London seem to be about cocktail bars - which is incredibly boring. However by searching a little further afield I was able to discover some local history and art based podcasts that are definitely more up my street.

The first interactive map I ever made was a mashup of Google Maps and YouTube. Ever since then I've believed that interactive maps can be a great way to search for localized media. Some other great examples of localized media maps are: 

The Poetry Atlas - an interactive map of poems written about specific places around the globe
The Watercolour World - an interactive map geo-locating the locations depicted in paintings
Historypin - an interactive map of historical and vintage photographs

Over the years I have reviewed many geo-located book and video maps as well. Most of these however seem to have joined the dead-pool.

Via: this was yet another map which I discovered via the wonderful Webcurios newsletter.

пятница, октября 27, 2023

3D Middle-earth

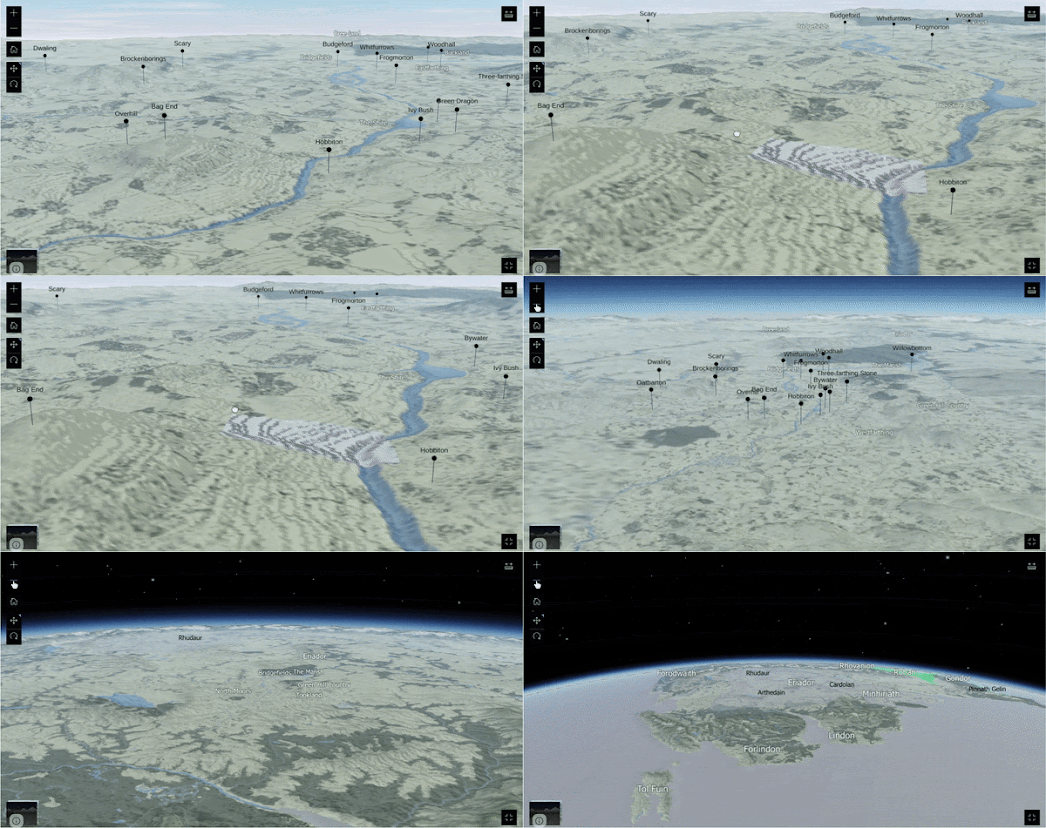
You can now explore the fantasy world of J.R.R Tolkein on a three dimensional globe. The Middle-earth 3D Map is a wonderful interactive map of the lands of the Shire, Mordor, Rohan and Gondor. A map that allows you to soar over the Misty Mountains, gaze upon the White City of Minas Tirith, and wander through the ancient forests of Lothlórien in a way that has never been possible before.

Unlike every other interactive map of Middle-earth that I have reviewed the Middle-Earth 3D Map includes elevation data. This means that you are able to explore the mountains of Middle-earth, such as Mount Doom and Erebor, from the perspective of a small Hobbit looking up at a distant summit disappearing into the clouds.

The 3D Middle-earth Map also includes a search engine. This means that you can create your own fly-throughs of Bilbo and Frodo's journeys. For example if you center the map on Hobbiton and enter Mount Doom you can watch as the map flies over Middle-earth before centering on Sauron's lair. This should give you a pretty good perspective of the distance and terrain that Frodo traversed in the six months of his adventure.

If you are a fan of Tolkien's novels then you will also love the interactive maps created by the LOTR Project. These include interactive maps of both Beleriand and Middle-earth. The LOTR Project interactive maps include place-name labels and lots of optional layers which allow you to overlay time-lines, route and events from Tolkein's novels directly on top of some wonderfully drawn interactive maps.

четверг, октября 26, 2023

Why the Spanish Like Vertical Living

Spaniards like living in apartments. In fact Spain has one of the highest percentages of apartment dwellers in the world. Only in South Korea do more people live in collective dwellings. There are historical reasons why so many Spaniards live in apartment buildings.

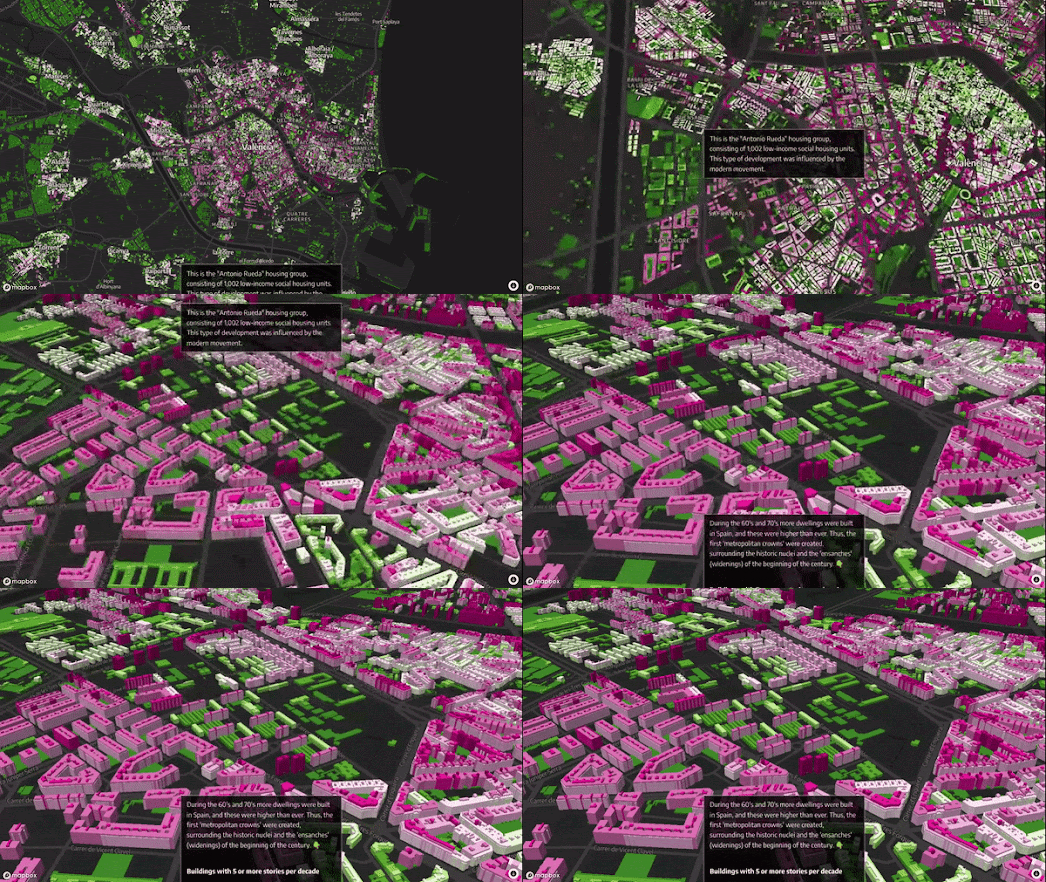
You can learn more about the historical causes of Spain's vertical living in El Diario's story map Spain lives in flats: why we have built our cities vertically. This map uses colored 3D buildings to visualize the height of buildings in Spanish cities (green buildings have the fewest floors and pink buildings are the tallest). As you scroll through the map El Diario takes you on an historical tour of Spain's residential building trends, explaining the historical reasons behind the construction of such a high number of apartment blocks in Spain.

As a huge supporter of vertical living, particularly in highly populated cities, I'm not exactly pleased to learn that one of the main historical reasons for Spain's high percentage of apartment living is the fascist dictator Franco. Apparently "between 1950 and 1975, thousands of Spaniards migrated from the countryside to the city". In order to accommodate the growing urban population Franco's government built high-rise housing estates.

At the end of 'Spain Lives in Flats' El Diario links to another of their interactive maps. This No. de Plantas Sobre Rasante map allows you to explore the differences in building heights that can be found in different Spanish cities. The El Diario article introducing this map, The map of the heights of all the buildings in Spain, includes a fascinating analysis of the urban landscapes found in ten Spanish cities. For example the map of Toledo reveals that the medieval center of the city is dominated by historical buildings and that all the modern buildings have been restricted to a similar height.

среда, октября 25, 2023

How to Avoid a Train Wreck

A very simple chart designed by a French railway engineer in the 19th Century has helped save millions of lives. Charles Ibry's train schedule, originally developed to timetable and schedule trains on the Paris - Le Havre line, is an extremely effective tool for timetabling and visualizing train traffic on a railway line. Perhaps most importantly it provides railway companies with a powerful visual aid to avoid potential crashes between trains traveling on the same line.

Chemins de Fer de Paris à Rouen et au Havre is a small scrollytelling presentation of how Charles Ibry's chart for timetabling trains is used and how it helps to avoid train companies scheduling potential train wrecks. As you scroll through the presentation the map sidebar and image annotations provide a walk-through of Ibry's chart and explain how the chart is used by railway companies to schedule trains.

Chemins de Fer de Paris à Rouen et au Havre uses a IIIF image of Ibry's chart from the Bibliothèque nationale de France. I have been able to use this image with the Leaflet.js mapping library thanks to Jack Reed's Leaflet-IIIF plug-in. I created the annotations using my own Leaflet-IIIF-GeoJSON tool. The annotation arrows used in the presentation use Webkid's leaflet-swoopy plug-in.

The Chemins de Fer can also be viewed in detail on the Bibliothèque nationale de France website. If you are interested then you can also view a completed chart of the Paris to Boulogne line on the bibliothèque's website. 

Charles Ibry's timetabling graph is also discussed on Hannah Fry's BBC Podcast This Train has Been Delayed (Part of Hannah Fry's Uncharted series). This Train is Delayed discusses how Ibry's graph recently helped Singapore's transit network finally discover a glitch which was causing their driver-less trains to seemingly stop at random between stations (when they weren't meant to be stopping).

понедельник, октября 23, 2023

Mapping the Brussels Terrorist Attack

On the evening of Monday October 16, a man drew a gun and opened fire on Swedish football fans in the streets of Brussels. The terrorist attack left two people dead and one injured. The suspect, Abdesalem Lassoued, fled the scene. Soon after the shooting a video was posted on social media in which Abdesalem claimed responsibility for the attack. The next morning the terrorist was tracked down, shot and killed by the police.

The broadcaster RTBF has created a storytelling map which uses photographs, video footage and an interactive map to retrace Abdesalem Lassoued's movements on the night of October 16th-17th. As you scroll through Here is the path taken by the October 16 terrorist minute by minute you can follow the movements of the murderous Abdesalem as he drives around Brussels on a scooter shooting at cars and people. You can then follow the murderer's movements after these attacks, based on the discovery of his vehicle and the police's interception of Abdesalem near his Brussels apartment.

RTBF were able to retrace the terrorist's movements on the evening of October 16th mainly using location data detected from photographs and videos. This location analysis was the result of a collaboration between the RTBF Décrypte team, Knack and on-line volunteers specializing in Open Source Intelligence

суббота, октября 21, 2023

Mapping the Growth of America

This animated map shows the growth of built-up areas in San Francisco from 1860-1930. It visualizes the rapid growth of the city following the California gold rush in the second half of the 19th Century.

This animated GIF was made using the interactive map Historical Built-Up Areas, 1810 - 2015. This amazing map uses data from the HISDAC-US: Historical Settlement Data Compilation for the United States to show built-up areas in the whole United States for every decade from 1810. 

Using the map's timeline you can select to view the built-up areas for any decade since 1810 or view any combination of decades. You can therefore use the map to view the historical development of individual cities or the whole of the United States over time. Zoom in on an individual city (such as San Francisco) and you can explore how and when the city developed. 

Each decade's data is color coded so if you select to view every decade's built-up area layer you can still see the chronological development of an area's buildings. For example if you zoom-in on the Northeast Corridor from Washington D.C. to Boston you can see that the suburban areas between the major cities appear as a yellowy-orange on the map, indicating that they were mainly developed in the second half of the 20th Century.

If you wish to view a city's development in higher resolution then you might have luck exploring the maps listed under the building age label on Maps Mania, which show historical developments in cities at the individual building level.

пятница, октября 20, 2023

Ephemeral Tweets

Musing appears to be an ephemeral version of Twitter. You might well argue that under Elon Musk the social media site 'X' itself appears to be disappearing into the ether at an alarming rate. But when I say that Musing is an ephemeral social media platform I mean that the social media messages themselves are short-lived, not the platform itself.

Confused? Well don't be. Just open the Musing interactive map and click on the 'new thought' button. Type in a message (limited to 356 characters) and your message will be added to the map (randomized to 500 meters of your current location). 

However your thoughts will only be added to the map for a short time. Musing's map of the whole world is limited to only 100 messages. So after 100 other people around the world add their thoughts to the map your musings will disappear forever. 

You might ask 'why'! But don't Musing says that "You can be shocked, surprised, amused, or just bored by what you read, but this is the beauty of it." You might even be inspired by reading the thoughts of the last 100 people to have used the Musing map.

Via: Webcurios

четверг, октября 19, 2023

The Rising Risks of Wildfire

Global heating has doubled the area of Europe which has a very high risk of wildfire. Civio has mapped the Copernicus Climate Change Service's meteorological forest fire risk index for every year since 1971. The map shows that The territory of Europe at high risk of fires has doubled in the last 50 years.

Europeans living in the Canary Isles, Greece, Sicily and the Algarve - which all experienced devastating wildfires this year - will need no reminding of the effect that climate change is having on the chances of life-threatening wildfires. Civio's animated map of 'days per year with very high or higher fire risk in Europe' shows that large areas of southern Europe now experience much higher risks of severe wildfire than they did 50 years ago. 

If you click on an area on the map and select a year you can view how many days in the year had a risk of wildfire (broken down into very extreme risk, extreme and high). Beneath the map you can also view the percentage of the country chosen which was affected by fire risk in that year (again this is broken down to show the percentage of days at very extreme risk, extreme and high risk).

In July of this year Europe witnessed its largest wildfire in 23 years. The Dadia forest fire in Greece burned 97,000 hectares and killed 20 people. The very large number of wildfires in Europe this year follows the even larger number of fires last year, a year which saw the second largest total burnt area this century. 

So far.

Czech news website Aktuálně.cz has analyzed satellite data of European Union wildfires since the year 2000 to calculate the total burnt area caused by fires for every year this century. A storymap in Burnt Europe maps out the size of European wildfires in 2024, 2023 and 2017 (the year with the highest total burn area). An interactive map at the end of the story also allows readers to explore in detail the wildfire burnt areas for every year since 2000.

A bar chart and line graph visualize the number of hectares burnt in each of the last 23 years. The data used for the charts and maps was taken from the satellite imagery of the European Forest Fire Information System. The Aktuálně.cz article includes a number of satellite images taken from EFFIS documenting some of Europe's worst wildfires this century.

среда, октября 18, 2023

The 2023 Polish Election

Sunday's Parliamentary Election in Poland saw the far-right PIS party win the most seats (194 seats) in the new parliament. However the opposition parties, consisting of the Civic Coalition (157 seats), Third Way (65 seats), and The Left (26 seats) achieved a combined share of 54% of the vote and are expected to now form a coalition government.

Thanks to the growing trend among newspapers to hide their work behind paywalls I haven't managed to find any interactive maps of the 2023 Polish Parliamentary Election. However Wikipedia has published a static map (above) showing a breakdown of the seats won by each party in each constituency. Each constituency is colored based on the vote share of the largest party in each constituency.

It has become customary after elections in Poland to compare the results with a map of the pre-1918 imperial borders.

As ever in the most recent Polish election we can observe a geographical split in results which seems to align with how Poland was divided in the 18th century. In August, 1772, Russia, Prussia, and Austria signed a treaty that partitioned Poland. Poland only regained its independence as the Second Polish Republic in 1918 after World War I. However, although the borders that divided Poland during the 18th and 19th Centuries disappeared over 100 years ago, that geographical divide seems to re-emerge in every Polish election.

The 2023 Polish Parliamentary Election appears to be no exception. On the Wikipedia map of the results we can see that the right-wing PIS party appears to have dominated in the eastern (pre-1918 Russian) part of Poland, while PO is the most popular party in the western (pre-1918 Prussian) areas of the country.

This split in voting patterns along the lines of the old Imperial borders has been observed in other Polish elections. Back in 2013 Irena Grosfeld and Ekaterina Zhuravskaya wrote about how the spatial pattern in the 2007 election in Poland was "determined, to a large extent, by the Partitions of Poland (1772-1918)". In The Past in the Polish Present the two professors argue that the very different economic and social policies which were followed by Russia, Prussia, and Austria in Poland for over a century have had a persistent legacy in Poland. This legacy appears to have emerged once again in this week's Polish parliamentary election.
Number of Villages per 100km2

In this Reddit thread comparing the 2023 Polish Parliamentary Election Results and the 1914 Imperial Borders user kolosmenus proposes that this geographical pattern in voting is mainly caused by urbanization. S/he argues that during the partition of Poland the Prussian areas were heavily urbanized while the other two partitioned states remained mostly rural. S/he links to the above map showing the Number of Villages per 100km2.

This correlation between urbanization and political support seems to make sense. We know from other western countries (including the US and the UK) that election results are often affected by the economic and cultural effects of rural and urban demographics. More affluent urban constituencies often tend to vote for more liberal and left-wing politicians, while less affluent rural constituencies often seem to vote for the more right-wing candidates and political parties.

вторник, октября 17, 2023

The Working Class History Map

History is written by the victors. Which may be why the ruling classes, composed as they are by the wealthy and powerful, have always been more interested in promoting their own history and perspectives than in giving a voice to the lives and achievements of the working class. As a result our history lessons and textbooks always focus on the exploits of kings, politicians, and other elite figures, while largely ignoring the contributions of ordinary people.

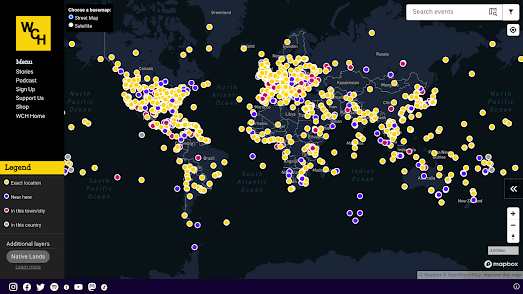
The Working Class History Map wants to redress the glaring elitism of traditional notions of our collective history by mapping the "stories of our collective struggles to build a better world." Zoom in your town on the Working Class History Map and you can discover the local stories of working class people, workers movements and working class acts of resistance. 

For example if I zoom-in on my neighborhood in East London I can learn more about the Plaistow Land Grabbers (unemployed workers growing food on squatted land) and the Matchgirls strike of 1888. The Working Class History Map includes over 10,000 stories of working-class struggles and achievements, so you should be able to find some working class heroes who played an important role in your own local history.

If you click on the funnel icon (next to the search box on the map) you can view the map's filter options. This allows you to refine the results shown on the map by date-range, by topics, by people and by organizations.

Via: Webcurios

понедельник, октября 16, 2023

AI Geography Quizzes

Do you know which ancient civilization created the earliest known map of the world? If you do then you might be able to beat Mashed Word's History of Maps quiz.  

Mashed World has developed a number of online quizzes (including one on the History of Maps) which have all been written by the ChatGPT AI. 

To create each quiz Mashed World gives ChatGPT an input in this general format:

Create a quiz for me on [subject] and output the quiz in spreadsheet format. Put the question in the first column, the correct answer in the second column, and the other answers in columns 3,4 and 5. If possible put a link in the sixth column to an article that confirms the accuracy of the correct answer.

ChatGPT has been known to hallucinate inaccurate answers so asking it to create a link confirming the correct answer can save you a lot of time if you want to ensure the accuracy of an AI generated quiz question.

The Mashed World library of quizzes includes a whole section on Geography Quizzes.  At the moment the Geography section of Mashed World includes 8 separate quizzes, including quizzes on Capital Cities, the Geography of North America, and the Geography of Europe.

Mashed World also includes a quiz section on Mapping. This includes three quizzes, one on Google Maps, a quiz about GIS and one about the History of Maps. I'm ashamed to say that I only got 5/10 on the history of maps quiz.

The Mapping and Geography sections are only two of many different collections of quizzes in the Mashed World library of quizzes. The library of quizzes also contains sections devoted to quizzes about Science and Nature, HistoryArts and Entertainment and even a whole section on Hamster quizzes.

суббота, октября 14, 2023

Tokyo Live

Tokyo Live is an amazing real-time animated map of the trains on Tokyo's rapid transit and metro networks. The map allows you to track and watch in real-time all of Tokyo's trains as they navigate and move around the city. All on top of an impressive 3D map of Tokyo.

I can't help thinking that Tokyo Live was probably inspired by the equally impressive Mini Tokyo 3D, which is a 3D animated map of Tokyo's overground and underground transit networks. One of the main differences between the two maps is that Tokyo Live uses 3D train models rather than the stylized colored blocks used by Mini Tokyo 3D.
Mini Tokyo 3D

Tokyo Live includes a drop-down menu which allows you to select any Tokyo transit line. This opens a single line map of the line's stations with all the trains shown moving along the line. You can select any station on this line to center the main 3D map on the chosen station. You can also click on any of the individual trains to center the map on that train and to track its movement in real-time around Tokyo.

Tokyo Live works by using train timetables from the Public Transportation Open Data Center for Tokyo Metro coupled with real-time transit feeds. The 3D building data on the map uses the scene layer of Tokyo buildings from Esri Japan.

If you are impressed by Tokyo Live and Mini Tokyo 3D then you should also have a look at some of the other live subway maps listed in the post The Best Real-Time Subway Maps.

пятница, октября 13, 2023

Intelligent Directions

Fuzzy Maps is a new interactive map which uses AI to provide intelligent walking, cycling or driving directions. Unlike directions in Google Maps you can ask Fuzzy Maps to provide you with directions which include custom conditions or requirements.

Fuzzy Maps provides a number of example searches that you might want to use, such as:

Bike directions to a nearby history museum, avoid going over hills
and
Walking directions to the Target closest to the westernmost Whole Foods in a 10-mile radius

One of the things I most like about Fuzzy Maps is that it provides a detailed commentary on the process it takes to calculate and provide a route based on your search requirements. For example I asked Fuzzy Maps to:

Provide walking directions from Times Square to Central Park, avoiding any bars

Fuzzy Maps responded by saying that 'to solve this problem we will follow these steps':
1. Use the `mapbox()` function to get the coordinates of Times Square and Central Park.
2. Use the `foursquare()` function to find all bars in the area.
3. Use the `routing()` function and specify a list of "avoid_points", to avoid any bars.

Fuzzy Maps then proceeded to display a route on the map from Times Square to Central Park which didn't pass any bars.

The AI behind Fuzzy Maps works a little like ChatGPT’s Code Interpreter. It generates Python code under the hood and runs that code for each step in its routing engine. This Python environment has the ability to query Mapbox for geocoding, Foursquare for POI search, Overpass for searching the OpenStreetMap database, and Valhalla for the actual routing.

Fuzzy Maps' reliance on Foursquare for POI search can limit the accuracy of its routing. For example in my example above (avoiding bars on a walk from Times Square to Central Park) the results are limited to Foursquare's knowledge of New York bars, many of which seem to be missing from the Foursquare database. 

Directions from Times Square to Central Park with more bars avoided

Obviously Fuzzy Maps can improve its results by adding more sources for its Points of Information. For example in my search I noticed that Fuzzy Maps had only used Foursquare to 'find all bars in the area'. I therefore asked Fuzzy Maps ' Can you include bars from Overpass in these directions'. In response Fuzzy Maps provided me with a new route from Times Square to Central Park which includes a lot more bars than in its initial route (which had been limited to bars in the Foursquare database).

Also See 

OSM GPT - use natural language queries to search OpenStreetMap. 
Texttomap - enter any geographical based question into Texttomap and it will attempt to answer your question and show you the results on a map 
mapsgpt - an interactive map which allows you to search using input forms to generate natural language queries.

четверг, октября 12, 2023

The Hezbollah Map

The Washington Institute's Lebanese Hezbollah is an interactive map dedicated to tracking the activities of the Islamist political party and militant group Hezbollah around the world. The purpose of the map is to serve as a repository of open-source information about Hezbollah’s global activities. The map is also intended to shed light "on the full geographic and temporal range of Hezbollah activities and also addresses an array of themes related to the group’s history, modus operandi, relationship to key sponsors such as Syria and Iran".

You can search the map for worldwide Hezbollah activities by category, location, timeline, and keywords. You can also filter the thousands of activities which are plotted on the map by type of activity (Plots & Attacks, Finance & Logistics, and Counter-terrorism  Actions). All Hezbollah activities are plotted on the map using colored markers which relate to each of these three main categories of activity.

A timeline along the bottom of the map allows you to filter the activities by date range. This timeline can be used to explore the history of Hezbollah activity, for example to explore the organization's foundation and earliest actions.

Wikipedia describes the Washington Institute as "a pro-Israel American think tank based in Washington, D.C."

среда, октября 11, 2023

Mapping the Causes of Haze

The Straits Times has published a fantastic visualization of how burning peatlands in Indonesia can lead to hazy conditions and dangerous air pollution in Singapore.

In Why the Haze has Reached Singapore's Shores Again the Straits Times has created a stunning computer simulation of the 2019 haze which affected Singapore. The simulation uses an animated smoke layer to illustrate how burning peatlands in Indonesia creates smoke which is then blown by the wind over Singapore. Further mapped simulations in the article explain how Indonesia's burning peatlands are a result of deforestation by palm oil plantations and of climactic events such as El Nino.

Why the Haze has Reached Singapore's Shores Again is just the latest in a number of truly outstanding mapped data visualizations produced by the Straits Times. These include Singapore 2030 - an interactive 3D mapped tour of some of Singapore's development plans, Singapore Underwater - a VR simulation of rising sea levels, and The Colourful History of Singapore's Street Names - a mapped analysis of the historical and cultural influences on Singapore's road names.

Via: Datawrapper's Data Vis Dispatch

понедельник, октября 09, 2023

Guess Thy Neighbor

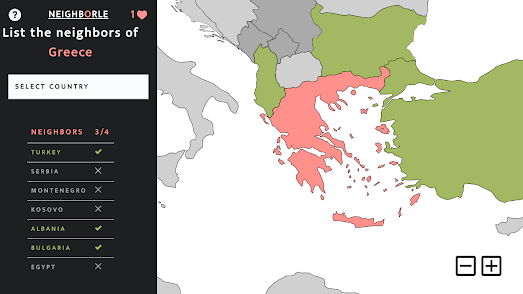
Can you name the four countries which border Greece? If you can then you should head straight over to Neighborle.

Each day on Neighborle you are shown a different country on an interactive map. Your daily challenge is to name all the countries which border that day's highlighted country. Every time you name a correct bordering country it will be shown in green on the map. If you enter an incorrect country then that country will be colored grey on the map. You are allowed to make five incorrect answers every day. Once you have made five incorrect answers you aren't allowed any more guesses.

Don't worry if you can't name Greece's four immediate neighbors there will be a new challenge tomorrow. A challenge centered on a completely different country.

Neighborle is just one of a number of daily geography map challenges inspired by NYT's daily Wordle game.

Worldle was one of the first daily geography challenges to emerge in the wake of the Wordle craze. Worldle requires you to name a country from just its map outline. Like the original Wordle game you have six goes in which to find the correct answer. And, like Wordle, there is only one game to play every day. Where Worldle differs a lot from Wordle is in the clues given after each answer. 

Instead of green and yellow squares Worldle uses arrows and percentages to help you get to the correct answer from your incorrect guesses. After each guess, you are told the distance you were from the correct country, the direction you need to move on a map and the proximity of your guess to the target country. With just these clues it should be possible to work out the correct answer within the permitted six guesses (particularly if like me you cheat and use a world map).

Light, Shadows & Fog

Brody Smith has written a couple of useful tutorials on how you can customize lighting, building and terrain shadows, and fog settings in Mapbox GL powered maps.

In Mapbox Lighting, Shadows, and Fog - Part 1 Brody looks at how lighting can be used to change the visual appearance of a map. In Mapbox Lighting, Shadows, and Fog - Part 2 Broady explores how tinkering with a map's fog settings can create depth and atmosphere, and how ambient and directional light can be used to simulate different light sources. 

Both posts include impressive demo maps. Part Two contains a 3D map view of Uluru. This map includes a number of filter controls which allow you to adjust the range, color, and star intensity settings. The map allows you to instantly observe the visual effect of adjusting these settings. This is very useful for anyone who wants to quickly experiment with the Mapbox fog settings to find the best configuration for their own maps. Part Two also includes an interactive map which allows you to adjust the ambient and directional light settings and instantly observe the effect that changing these parameters has on the visual appearance of the map.

Part One includes a beautiful interactive map of Sydney Opera House. This map includes a control which allows you to select from each of the four preset light settings in Mapbox GL. This allows you to see how the 3D building of Sydney Opera House and its immediate environment look with Mapbox's default day, dawn, dusk and night settings. When creating your own maps you aren't restricted to these four presets and you can use the Mapbox Lighting API to create custom lighting effects for your own maps.

воскресенье, октября 08, 2023

Mapping the Barassi Line

The Barassi Line is an imaginary line across Australia that approximately divides areas where Australian rules football or rugby league is the most popular football code. The line is named after Ron Barassi, a former player and coach in Australian Rules Football. The term the 'Barassi Line' was first used by historian Ian Turner in his 1978 Ron Barassi Memorial Lecture. 

The Barassi Line represents a cultural divide in Australia, with different regions showing a preference for one sport over the other. The line is generally accepted to run from Eden on the south coast of New South Wales, through Canberra and Broken Hill, and into the north-east of the Northern Territory. However like many borders around the world the exact location of the Barassi Line is a matter of some contention. Which is why The People's Republic of Couch has decided to settle the matter for good. 

An interactive map in The Barassi Line shows the location of Ian Turner's original border between Australian rules football & rugby league, and the Republic of Couch's new definitive Barassi Line. This new more accurate border was calculated by plotting the locations of all Aussie rules and rugby league football clubs in Australia. Then each suburb in the country was marked as either Aussie rules or rugby league depending on which code had the most clubs. Then by Voronoi mapping this data it was possible to plot a more detailed Barassi Line, showing the real divide between Aussie rules and rugby league supporting Australians.

Back in 2019 Zeit attempted to map the popularity of a number of different sports around the globe. In the article Little Sports Atlas Zeit used OpenStreetMap data to plot where different types of sport are actually played across the globe. 

The popularity of many different sports has a geographical basis. For example ice hockey is most popular in a thin band of latitude in the northern hemisphere - a thin band of latitude which is often cold in the winter and where water often turns to ice. Cricket on the other hand is popular in a few different countries - countries which were all at one point part of the British Empire. 

The one true world sport in the Little Sport Atlas is football. In fact Zeit claims that the map of where football is played could almost double as a map of the world's population.

суббота, октября 07, 2023

The Ring of Rain

X-Rain is an interactive map which visualizes the average amount of rainfall around the globe. The precipitation data used on the map is derived from historical satellite observations. This remote sensed data is not as accurate as data recorded by rain gauges but it is able to provide a more global view of precipitation levels as it is not limited to only those locations with rain gauges.

The X-Rain map provides a very clear visualization of the ring of rain around the Earth's equator. Areas near the equator receive higher levels of rainfall due to convectional rainfall. Because the equator is located in the tropical region where the sun is most direct and intense it can receive more rain than other latitudes. The intense heat of the sun at the equator causes warm, moist air to rise rapidly, resulting in convectional uplift. As the air rises, it cools, condenses, and forms clouds. This process leads to heavy precipitation and frequent rainfall in equatorial regions.

NASA's Earth Observatory has created an animated map of annual Total Rainfall. This map shows total monthly rainfall using data from NASA’s Integrated Multi-satellitE Retrievals for GPM (IMERG). Again you can see that most areas near the equator receive above average levels of precipitation, due to convectional rainfall.

NASA's animated map of monthly rainfall totals also does a great job of visualizing the seasonal patterns in precipitation. According to NASA "about two-thirds of all rain falls along or near the equator, and countries in those latitudes often have several months of near-daily rain followed by months of dryness as the rain band moves north and south." These seasonal changes are why many parts of Asia experience monsoon conditions between April and September and South America experiences a rainy season from October to May.

пятница, октября 06, 2023

The London Underground Map Quiz

The London Underground consists of 269 stations. I bet you can't name them all.

London Underground Names is an easy map game which simply requires you to name all 269 stations on the London Underground network. Naming all 269 stations is a little tricky so I've provided you with a couple of aides to help you remind you of some of the station names. 

Due to my personal commuting history I can name all the stations on the Victoria Line and the Jubilee Line. However if you asked me to reel off the names I'd probably omit a couple of stations on each line. I've therefore added an option to the map to view the locations of all the stations on a chosen line. I find this helps me to see which stations on a line I've missed out and still need to name.

There are lots of London Underground stations I couldn't name without a little help. I've therefore added a clue to every station's name for those who need it. If you need a clue to a station's name simply click on the station's marker on the map.

London Underground Names was inspired by the brilliant SF Street Names, which requires you to name the streets in San Francisco. I decided that London had far too many streets for a similar game in the English capital and decided that London Underground stations was a far more manageable challenge.

If you want to create a similar game for your own city's transit network then you can clone and adapt London Underground Names on its Glitch page.

четверг, октября 05, 2023

Your Perfect Weather Map

We all have our own ideas about what the ideal weather conditions actually are. myPefectWeather is an interactive map which can help you find the locations in the United States which most closely match your own preferred temperatures, precipitation levels and /or amount of snowfall.

If you select the 'options' button on the myPerfectWeather map menu you can begin to discover the locations across America which most resemble your ideal climate zone. For example - if you select 'the average high temperature' filter then you can enter your desired range of maximum temperatures. The map will then adjust to visualize the places that most closely match your preferred temperature range. 

You can also filter the map by average daily precipitation, average daily snowfall and comfortable weather days. You can also view a detailed breakdown of the annual weather conditions in any city by using the map's search box.

The Goldilocks Zone Finder is an interactive map which can help you find the location in the United States which has your perfect year-round temperatures. Just tell the map the hottest and coldest temperatures that you are happy to live with it and it will show you a map displaying the number of days per year which fall within your own personal Goldilocks temperature zone, for all locations across the United States.

The Goldilocks Zone Finder was created by Luke Champine who wanted to find a place to live which fell within his own personal temperature preferences. The map uses data from NOAA's 30 Year Climate Normals, which uses 30 years of weather measurements taken across the United States to calculate daily temperature averages. The NOAA Climate Normals also includes averages for precipitation and other climate variables but these are not included on the Goldilocks Zone Finder.

The Goldilocks Zone Finder currently only works for the United States but if you are interested in building a similar map for another country the code for the project is available on GitHub.

If you want to explore local average temperatures by day of the year in a little more detail then you might also like the County Climate interactive map. This map shows the average maximum temperature in every county for every day of the year. 

If you select a date from the slider at the top of the map you can view the average temperatures on that day across the whole country. If you select a county on the map you can also view a graph showing the average maximum temperature in that county for each month of the year (based on temperature data from 1979-2011). 


The temperature may not be the only data that you want to consider in your attempts to find a location which has your perfect weather. In that case you could use Peter Kerpedjiev's map of annual worldwide weather data. The map uses historical climate data from Wikipedia's city 'weather boxes' to visualize how weather changes during the year around the world.

Using the Sunshine Map it is possible to view the number of hours of sunshine across the globe for every month of the year. The map also allows you to view the changing rates of precipitation, the highest & lowest temperatures, and the amount of snowfall. 

The Sunshine Map uses Jason Davies' D3 voronoi library to divide the world up into regions based on the closest city with Wikipedia climate data. This does mean that where Wikipedia only has a few cities with climate data.the Voronoi areas can be quite large.

среда, октября 04, 2023

The 10 Day Fall Color Forecast

The Fall Foliage Map 2023 is an interactive fall foliage map which is updated daily to provide you with both an accurate progress report of fall colors and a forecast of how fall colors in the United States are likely to change over the next ten days.

According to Explore Fall the main factors influencing fall colors are the temperature and daylight. The Explore Fall predictive fall color model uses real-time weather conditions and user submitted fall foliage reports to forecast fall foliage colors throughout the Lower 48.

The Fall Foliage Map shows the observed fall foliage colors for every day since September 1st. You can use the map's date control to view the observed fall colors for any day. You can also use this control to explore Explore Fall's ten day forecast of how fall colors are predicted to progress in the next few days.

Every year Smoky Mountain releases their own interactive Fall Foliage Map, which plots the annual progress of when and where leaves change their colors across the United States. The Fall Foliage Map uses historical weather records from all 48 continental states to predict the arrival of fall at the county level across the contiguous United States. This map also includes a date control which allows you to view the leaf color you can expect for any date from the beginning of September through to the end of November.

вторник, октября 03, 2023

Shilling for Putin

The Insider ('fully committed to investigative journalism and to debunking fake news') has created a new interactive map which exposes the 'fake experts' around the world that are spreading pro-Kremlin fake narratives and Russian propaganda. The Insider claims that what "unites the individuals featured on this map is their attempt to portray Putin's policies positively while disseminating outright misinformation."

If you click on a country on the Fakesperts map you can view a list of the individuals in that country who are used by Russia to spread fake news. In the United States one of the pro-Kremlin fake experts exposed by the map is the disgraced Tucker Carlson. Carlson is a well-known Putin fanboy, who frequently espouses lies about Ukraine and has bent over backwards to support the Russian invasion of Ukraine. 

In the UK ex-goalkeeper and self-proclaimed 'son of God' David Icke appears on the map. Although seen as a figure of ridicule in the UK he often appears on Russian television venting anti-Semitic conspiracy theories centered on George Soros.

Often the individuals identified by the map are little known in their own countries. For example the map identifies Daniel Patrick Welch in the United States as a 'fakespert'. Welch is the manager of a small daycare center in Boston, who is often used by Russian television as a political analyst. This is probably because he will say anything he is paymasters wish, for example that Ukraine sold weapons to ISIS and that the war in Ukraine will lead to the end of the European Union and NATO.

понедельник, октября 02, 2023

The October Solar Eclipse Map

In 12 days time people in North, Central, and South America will be able to experience a solar eclipse. On Saturday, Oct 14 an annular solar eclipse will occur which will be visible in some areas of the United States, Mexico, and a number of countries in Central and South America.

NASA's 2023 Solar Eclipse Explorer is a new interactive map which visualizes the path of the solar eclipse on Oct 14 down to the second. The map shows a darkened strip, which visualizes the path of the umbra, the area in which people can experience a total eclipse. You can also turn on a penumbra layer which visualizes where people can experience a partial eclipse.

Everyone living in the contiguous United States should be able to see at least a partial solar eclipse on the 14th. NASA's map allows you to view the percentage of the eclipse you can see from your location. Citizens of New York will be able to see a 23% eclipse. Los Angeles will see about 70% of the sun covered by the moon, and in San Francisco you will get a roughly 75% eclipse.

If you click on a city's place-name label on the map you can view a simulated image of the eclipse from that location, the current weather conditions in the city and the times of the beginning, fullest and end of the eclipse at the selected location. A countdown is also provided showing how much time remains until the moment of maximum coverage for your city.

The map's time slider allows you to see at which times the Antumbra will be visible. This is when the moon passes in front of the sun at your location and you should be able to see a 'ring of fire' around the moon. If you adjust the map's slider you can see the progress of the solar eclipse over the course of Oct 14 and discover when the solar eclipse will occur at any location.

воскресенье, октября 01, 2023

Inside the Tombs & Pyramids of Egypt

Ramesses I was the founding pharaoh of ancient Egypt's 19th Dynasty. Ramesses burial tomb was rediscovered in the Valley of the Kings by Giovanni Belzoni in October 1817. The tomb is decorated with the Book of Gates. The Book of Gates tells the story of how a newly deceased soul travels into the next world by passing through a series of 'gates'. It is believed that the depiction of this journey was placed in tombs in order to help the deceased soul navigate through the afterlife.

You can learn more about the Book of Gates in Mused's virtual tour of The Tomb of Ramesses I. The tour explains who Ramesses I was and guides you through the amazing scenes from the Book of Gates which adorn the walls of the tomb. Using custom created 'Street View' panoramas the funerary text of the Book of Gates is retold through a narrated guide of the tomb's decorated walls. Following the tour you can follow the journey that Ramesses I's soul hoped to take into the next life.

If you select the 'Free Explore' button at the start of the tour then you can explore the tomb of Ramesses I for yourself without the narrated guide. Just click on the circles to move around the tomb and pan around and zoom in and out to view the decorated walls in more detail. 

If you register with Mused you can experience many more guided virtual tours of important archaeological sites in Egypt, including the tombs of Tutankhamun, Ramesses II, and Queen Meresankh III.

Mused's Inside the Great Pyramid of Giza is an amazing virtual 'Street View' tour of the normally closed inner chambers of the Khufu Pyramid in Egypt. This guided tour allows you to explore the interior three chambers of the pyramid, including the King's Chamber, the Queen's Chamber and the subterranean chamber, which is cut into and decends into the bedrock below the pyramid itself. 

The Khufu Pyramid or Great Pyramid of Giza is the largest of the Egyptian pyramids and is the tomb of the pharaoh Khufu, who died in 2566 BC.The Great Pyramid was the world's tallest building for more than 3,800 years. Very few people are allowed inside the Great Pyramid of Giza. Today you can be one of them. 

The tour enters the pyramid via a robber's tunnel believed to date back to 820 BC. At the entrance of this tunnel you have two choices. You can either take the Guided Tour or use the Free Explore option. The guided tour uses custom made 360 degree panoramic 'Street View' imagery to lead you inside the pyramid and into the three chambers. This guided tour includes contextual annotations which explain what you are seeing during the tour. 

The 'Free Explore' option allows you to enter and explore the pyramid alone. In this mode you are left to your own devices to use the navigation circles added to the panoramic imagery to virtually explore inside the Great Pyramid.

Of course Egypt isn't the only country with ancient pyramids. If you travel south down the River Nile through Egypt to Sudan, just before you get to Khartoum you will come to Meroë, the ancient capital of the Kushite Kingdom. Here you will discover an ancient city which is home to more than 200 pyramids.

Google Arts and Culture's Pyramids of Meroë is a fascinating virtual tour of the Nubian pyramids located in the Sudanese desert. The Pyramids of Meroë were constructed in the Kingdom of Kush during the Meroitic period (542 BC–4th century AD).

As you scroll through the Pyramids of Meroë you are taken on a virtual tour of a 3D model of the pyramid of King Arkamani the First. This tour explains how these distinctly steep sided structures were built over 2,500 years ago. Keep scrolling and you can dive inside the pyramid, explore the hieroglyphs on the Offering Chapel's walls and view a 3D illustration of the pyramid's underground tomb. 

After exploring the 3D model of King Arkamani the First's pyramid you can explore Meroë for yourself using Google Maps Street View. This Street View tour includes interactive panoramic images of the partially buried pyramid of King Kalka Kaltaly, the pyramid of Queen Amanitore and the pyramid of King Adeqetali.