The OS Mapping Toolkit

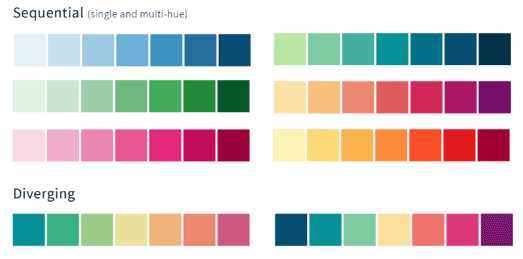
The UK's Ordnance Survey has a released a GeoDataViz Toolkit designed to help map makers 'communicate data effectively'. It includes colour palettes, map symbols and visual deconstructions. It also includes lot of advice for creating effective visualizations and many links to other helpful resources.
The Basemaps section of the toolkit will probably be of most interest to users of the OS Maps API. However the Colours, Symbols and Visual Deconstructions sections have more cross-platform appeal and should be of interest to all online map makers, whatever your preferred mapping platform.
The different sections of the toolkit are full of useful guidelines and recommendations for visualizing data with maps. Each section also includes lots of links to other useful resources. You can learn more about the GeoDataViz Toolkit and how it is used internally within the Ordnance Survey on the Ordnance Survey Blog.


Комментарии