US Car Fatality Hotspots
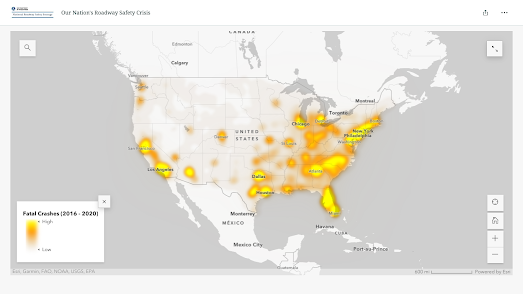
The U.S. Department of Transportation has released a series of interactive maps which visualize where fatal road accidents are a problem on America's roads. The number of roadway fatalities and the fatality rate on U.S. roads increased in 2020 and 2021. In Our Nation's Roadway Safety Crisis the DoT has created a series of maps which visualize fatality hotspots, fatalities compared to the national average, and fatality rates & population density.
While I would normally wholeheartedly support a geographical analysis of road fatalities across the country I think that the DoT's mapped analysis ignores one important factor - the growth in SUV ownership. According to motor1.com the "truck/SUV market share increased by 9.9 points between 2019 and 2022". SUVs and pickups in the "first four months of 2022, (made up) 72.9 percent of total passenger car sales". I suspect that if you are looking for a reason for the sudden uptick in road fatalities in the USA then you needn't look past the rise in SUV ownership. Those things are lethal.
The first of the DoT's maps looks at roadway fatality hotspots over the past five years. In some ways this map obviously resembles a population density map. When you are looking to reduce the overall number of road fatalities then it does make sense to look at where the most fatalities actually occur (even if the actual fatality rate adjusted for traffic or population density is actually relatively low).
Other maps in the DoT's analysis do adjust for local population numbers. For example a Fatality Rate vs Population map (shown at the top of this post) uses a bivariate color ramp to show in yellow areas with a high fatality rate and a low population. These areas are therefore identified as target areas for the DoT's roadway safety initiatives. What those initiatives are I cannot say as the DoT says that "future iterations of this analysis will explore how USDOT funding is addressing roadway safety".


Комментарии
- the increase in drug consumption and misuse of medication, the number of overdose death has doubled within the last five years. Drivers take part in traffic under the influence of drugs and medication, increasing the risk of an accident greatly
- the use of smartphones and other distractions in traffic
- poverty and the need for many people to work multiple jobs, including jobs requiring driving (delivery, Uber etc.). This results in overworked and thus tired drivers...