Mapping a Game of Basketball

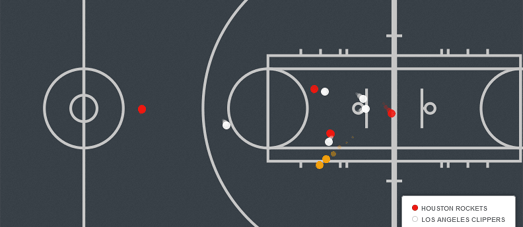
NBA Movement is an animated map which plots a passage of play during the Clippers vs Rockets game on May 12th, 2015.
The map uses data from stats.nba.com. Savvas Tjortjoglou has written up a nice tutorial explaining how you can extract the data from play by play movement animations at stats.nba.com. Jorge Sanz has used this tutorial to get the data for the Clippers vs Rockets game.
The data has been mapped and animated using CartoDB's Torque library. The result is a neat animated map which tracks the players of both teams and the ball during one passage of play during the game.

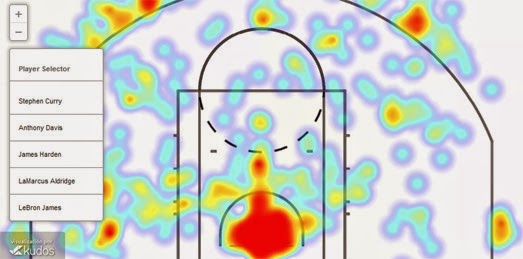
Player heatmaps are very popular in lots of different sports. In the NBA shooting heatmaps can be used to reveal the individual shooting patterns of different players, showing where they are most dangerous on the court. 2014-15 NBA Regular Season : Field Goal Shooting Patterns is a CartoDB map that shows the shooting heatmaps of five players during the 2014-15 season.
Using the map you can view and compare the shooting heatmaps of Stephen Curry, Anthony Davis, James Harden, LaMarcus Aldridge and LeBron James.

It is also possible to use CartoDB's Torque library to create animated heatmaps. For example, this CartoDB Referee Map is an animated heatmap of one soccer referee's movements during a soccer game. The map uses CartoDB's Torque library to animate the referee's movements over the ninety minutes of the match. If you pause the animation and move the timeline to the beginning of the game you can see the full GPS track of the referee over the ninety minutes without the heatmap layer.


Комментарии