Maps of the Week

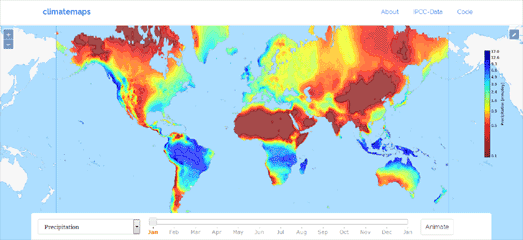
Climatemaps visualizes the weather over the course of a year around the whole world. The map animates average global monthly climate data from 1961-1990 to show you when every location in the world has its hottest, driest or wettest weather.
You can select from a range of weather layers from the drop-down menu (including precipitation, cloud cover and average temperatures). You can then view the weather data animated on the map through a whole year (you might need to let the animation play through a couple of times before the layers load completely).

A new crowd-sourced tool plans to monitor deforestation and other environmental damage caused to the planet around the world. Map for Environment uses OpenStreetMap mapping tools with satellite imagery of known logging, industrial agriculture, dam, and fracking locations to help map how these industries are effecting the environment.
If you log-in to Map for Environment with an OpenStreetMap account you can begin to help map logging roads, the spread of industrial agriculture, dams and fracking sites. You can also view the work already logged on four animated maps. For example you can observe the huge spread of logging roads in the Congo Basin on the animated Logging Roads map. This map uses historical satellite imagery to show the spread of logging roads in the Congo Basin over recent years.

Speigel has created a fascinating visualization of the regional variations in the German language. More than 670,000 people throughout Germany were asked which words they used for 24 common terms. The regional differences in their answers were then plotted on an interactive map.
To create the Alltagssprache map Germans were asked what words they used for various terms, such as pancakes, meatballs and chatting. The interactive map plots where Germans used different words for these common terms. The different colors on the map show were the various different words were used. The opacity of each color shows how common a particular word was used at that location,
You can use the forward and back buttons at the top of the interactive map to browse through the visualizations of each of the 24 tested in the language survey.


Комментарии