
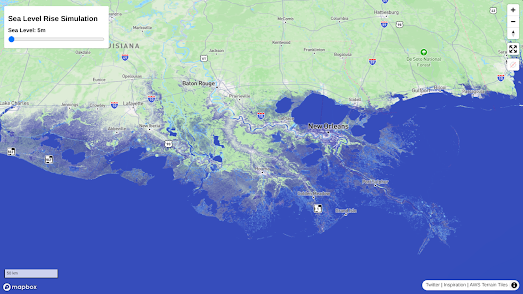
Darren Wiens' new Sea Level Rise Simulation map shows how rising sea levels might effect coastlines around the world. Using the simulator you can adjust the height of the sea around the world to see what level of global heating will turn your town into the next Atlantis.
Darren's map uses AWS Terrain Tiles with Mapbox GL's raster-value expression to visualize global sea levels. In very simple terms the map layer turns blue based on the elevation level that the user selects using the sea level slide control. In other words the Sea Level Rise Simulation is only a very rough guide as to how different sea level rises might affect your local environment.
One indication that the Sea Level Rise Simulation map is not intended to be used as an authoritative guide to rising sea-levels is the sea level rise control used on the map. The control only allows you to adjust the sea level visualized on the map in 1 meter increments.
According to the U.S. Global Change Research Program sea levels have risen by just over 8 inches since 1850. Global heating is however accelerating the rate by which sea levels are rising. According to NOAA the U.S. coastline is predicted to rise by "10 - 12 inches (0.25 - 0.30 meters) in the next 30 years". Unfortunately using the Sea Level Rise Simulation map it isn't possible to adjust sea levels in steps smaller than one meter (so the map can't show you the result of a 10 inch rise in sea levels).

Climate Risk's Coastal Risk Map also allows you to view your risk from projected sea level rise and coastal flooding by year, water level, and by elevation.Share your location with the Coastal Risk Map and you can view the potential flood risk for different years and for different levels of predicted sea level rise.
The Coastal Risk Map includes a warning that the map may include errors and should only be used as a tool "to identify places that may require deeper investigation of risk".
Coastline Paradox uses Google Maps Street View imagery to visualize how rising sea levels are likely to affect locations around the world over the next three hundred years. The map was created by Finnish artists Pekka Niittyvirta and Timo Aho to provide a powerful visualization of likely sea level rises and their effects on global migration.
Using Coastline Paradox it is possible to view the likely effects of rising sea levels at locations around the world for any year between now and 2300. Select one of the global locations marked on the map with a blue dot and a panoramic Street View image will appear. Superimposed on top of this image is a glowing white line which shows the likely future sea level at that location. You can adjust the date for the sea level prediction at any location by using the timeline control above the map.
No comments:
Post a Comment