Skip to main content
Search
Search This Blog
Maps Mania
Posts
Showing posts from April, 2022
Show all
April 30, 2022
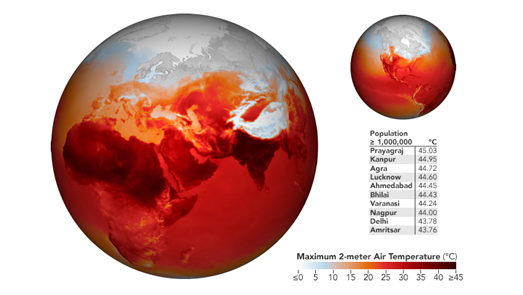
Coal Power & Extreme Heat
April 29, 2022
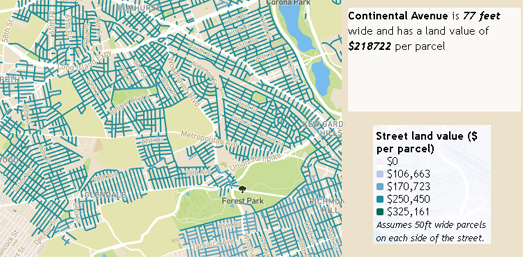
Street Widths in American Cities
April 28, 2022
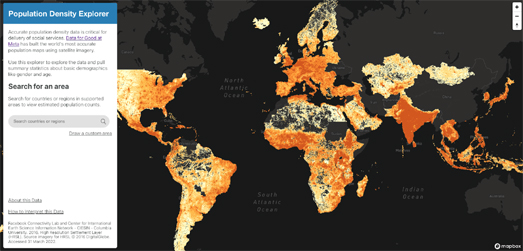
A New Global Population Explorer
April 27, 2022
Step Inside a New York Tenement
April 26, 2022
Mapping in the Shadows
April 25, 2022
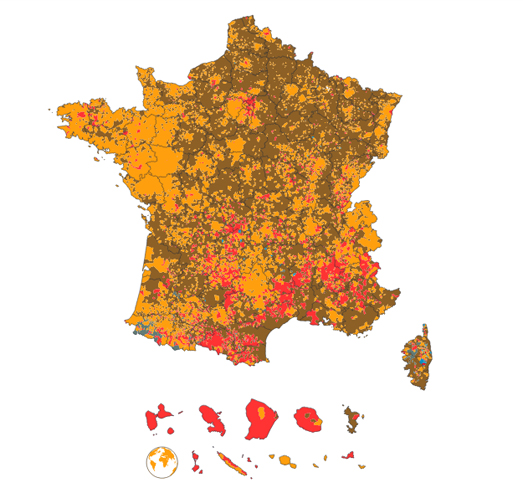
2022 French Election Maps
April 23, 2022
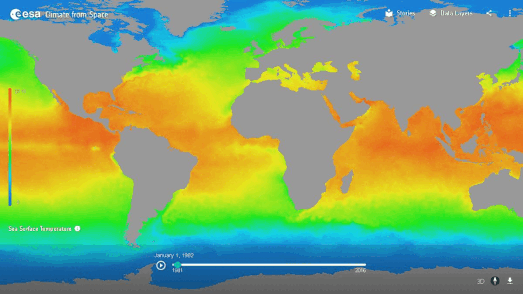
Global Warming is Happenng
April 22, 2022
Earth Day Doodles
April 21, 2022
64 Days Since a Global Warming Record
April 20, 2022
The Las Vegas Building Age Map
April 19, 2022
Explordle
April 18, 2022
What Two Numbers?
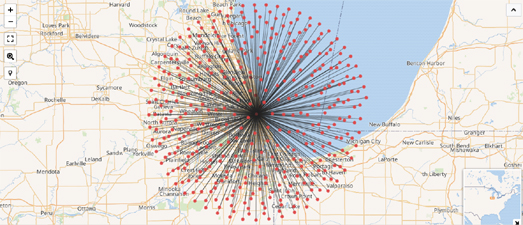
April 16, 2022
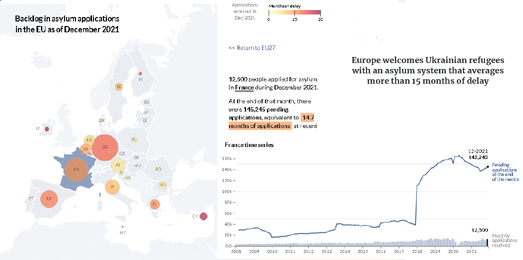
Europe's Refugee Backlog
April 15, 2022
Movie Maps
April 14, 2022
The New Racial Dot Maps of America
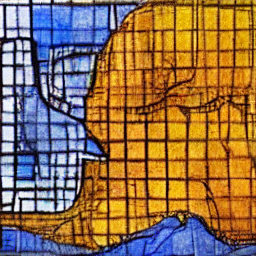
April 13, 2022
AI Generated Maps
April 12, 2022
Mapping the French Election
April 11, 2022
Exploring Patterns in Placenames
April 09, 2022
Four Seasons in One Map
April 08, 2022
The Floating Shiny Knot is Back
Newer Posts
Older Posts
Home