Drowning in Plastic
There are five large ocean garbage patches. Most people have heard of the Great Pacific Garbage Patch, but there are also the North Atlantic, South Atlantic, Indian Ocean, and South Pacific garbage patches.
These garbage patches form due to ocean currents called gyres, which trap floating debris in circulating patterns. Over time, waste such as plastic bottles, fishing nets, and microplastics accumulates in these areas. The primary causes include improper waste disposal, runoff from rivers carrying trash into the sea, and discarded debris from ships and fishing activities. This pollution poses serious threats to marine life, ecosystems, and human livelihoods.
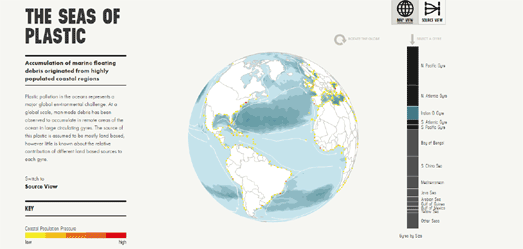
The Seas of Plastic is another mapped visualization of the floating plastic debris polluting the world's oceans. This interactive visualization features a globe highlighting the five major circulating gyres of plastic in the North Pacific, North Atlantic, Indian Ocean, South Atlantic, and South Pacific. It also includes a Sankey diagram that illustrates the amount of plastic debris contributed by different countries to each of these gyres.
The data for the Seas of Plastic visualization is based on a Lagrangian particle tracking model, which simulates 30 years of input, transport, and accumulation of floating plastic debris worldwide. The model traces the paths of plastic particles from land to sea, providing estimates of the relative size of each of the five circulating gyres.
The Ocean Cleanup organization estimates that between 1.15 and 2.41 million metric tons of plastic in the oceans originate from the world's river systems, with two-thirds coming from rivers in Asia. To illustrate how and where plastic enters the world’s oceans, The Ocean Cleanup has released an interactive map titled River Plastic Emissions to the World’s Oceans.
The map highlights river systems across the globe, with scaled circular markers at the coast representing the predicted plastic input from each river system. These predictions are based on a model that considers factors such as population density, waste management practices, topography, hydrography, dam locations, and reported plastic concentrations in rivers worldwide.


Comments