Monday, October 10, 2022

The 2022 Austrian Election Maps

Alexander Van der Bellen appears to have won a clear majority in yesterday's election in Austria, winning a second six-year term as President. Van der Bellen is a previous leader of the Green Party. In the 2016 Presidential election he ran as an 'independent candidate', however his candidancy was supported by the Green Party.

Current projections suggest that Van der Bellen will receive around 56% of the vote (an increase of around 2.2% on the 2016 election). His nearest rival, of the far-right FPO, is projected to achieve 17.9% of the vote. By achieving over 50% of the vote Van der Bellen will be directly voted President and will avoid having to enter a second round of voting. 

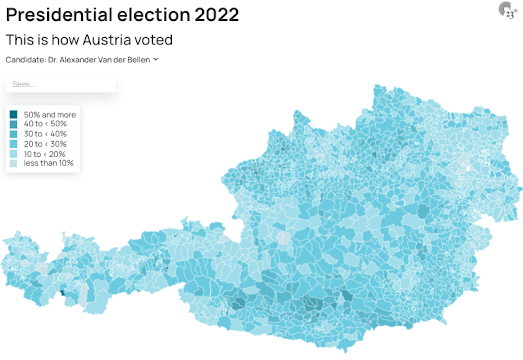
Austrian newspaper Österreich has published an interactive map which visualizes the 2022 Presidential election at the individual electoral ward level, at the district level and at the state level. The state level map shows the large levels of support for Van der Bellen across nearly the whole country. The incumbent won over 50% of the vote in every state except for the southern state of Kärnten.

23degrees has also released an interactive map of the 2022 Presidential Election. This map allows you to view the number of votes cast for each candidate at the individual ward level. For example the screenshot above shows the number of votes cast for the FPO's Walter Rosenkranz in each electoral district.

Italy's Election Map Street by Street

voter turnout in Turin 2018 & 2022

Voting Street by Street is an interactive map which allows you to analyze the 2022 Italian General Election results down to the street level in four of Italy's largest cities. The map allows you to explore which party voters supported at the hyper-local level and compare the results to previous elections. The map also allows you to compare voter turnout and support with a number of demographic and economic variables.

The 63.9% turnout for the 2022 election was a record low. It was a full 9% below the turnout for the 2018 election. Using Voting Street by Street it is possible to view a side-by-side comparison of the 2018 and 2022 election turnouts. You can also compare the voter turnout percentages to local demographic and economic factors. My superficial reading of the Voting Street by Street map is that voter turnout tended to be highest in the center of Italy's major cities and lowest in the suburbs. Comparing the turnout data to the socio-economic census data suggests that voter turnout also tended to be lowest among the economically disadvantaged.

Voting Street by Street also allows you to view the support for each of the main political parties at a hyper-local level. Using the map you can compare each party's support at the street level in the 2022 and 2018 elections. You can also compare support for each party with the socio-economic and demographic variables (for example to see if there is a correlation between unemployment and voting for the Brothers of Italy).

You can view a number of national maps of the 2022 Italian election on the Italian Election Maps post on Maps Mania.

Saturday, October 08, 2022

Watercolor World

Watercolor World has added the Scott Polar Research Institute's collection of watercolor paintings to its interactive map of watercolor paintings. Watercolor World is an interactive map and free online database of documentary watercolour paintings, all of which were painted before 1900.

The Scott Polar Research Institute at the University of Cambridge owns a large collection of polar paintings by painter-explorers such as Edward Wilson and Captain Walter William May. You can now browse and view a selection of these polar paintings on Watercolor World.

Of course the Watercolor World interactive map doesn't restrict itself to polar paintings. In fact one of the great joys of Watercolor World is searching for historical watercolor paintings of locations near your own home. Using the interactive map you can search for watercolour paintings of your favorite locations. It is also possible to search Watercolour World's huge collection of digitized paintings by artist name, by art museum collection, by category or by tag.

Also See 

Ukiyo-e Map - an interactive map of geo-located prints by the Japanese artist Hiroshige 
Place to Paint - the interactive map for artists to share the locations where they paint and the artworks which they have created at those locations

Friday, October 07, 2022

Maps Sans Frontieres

Russia's interactive maps no longer have country borders. If you visit Russia's online map service Yandex you may notice something a little odd, especially if you are trying to find the international border between two neighboring countries. This is because Yandex no longer displays country borders on its map. 

The Moscow Times quotes a Yandex spokeperson as saying that the decision has been taken to drop international borders in order to "focus on natural features rather than on state boundaries. Our task is to display the world around us. So the map will show mountains, rivers, and other data usually found on such maps".

It isn't uncommon for interactive map companies to have issues with international borders. Google Maps for example may show you different international boundaries depending on which country you are accessing the map from. For example, according to The Guardian, if you

"Look at the Crimean peninsula on Google Maps UK – it’s separated from Ukraine by a dark-grey dotted line to mark a disputed border. Look at it on Ukrainian Google Maps and the dotted line is light-grey, of the sort used to demarcate states. On Google Maps Russia? A solid black country border, showing Crimea as part of the country."

What is unusual however is for an interactive map provider to remove international borders completely. As the Moscow Times reports Yandex's decision to drop international borders from its map coincided with the decision by pro-Kremlin officials to hold fake referendums in Russian-occupied areas of Ukraine in order to try and illegally annex these territories.

The removal of all international borders by Yandex does suggest that there is no limit to Putin's ambition. If Russia's neighbors were not already worried about Putin's future plans they probably are now. The only people who are probably sleeping a little easier after this decision by Yandex are Russian cartographers.

Thursday, October 06, 2022

Parkulator

Parkulator is an interactive mapping tool which allows you to discover how much of your town is dedicated to parking lots, golf courses, brownfield sites, solar generators or parks.

If you draw an area on the Parkulator map you can choose to find out how much of that area's real-estate is claimed by parking lots (or golf courses, brownfield sites, solar generators or parks). Parkulator will also tell you how much housing or how many parks could be built instead on that area of land.

USA Parking Lots is an interactive map of the United States which blacks out every single parking lot in the country. Of course because this is America it means that if you zoom in on a major city the map displays a lot of black polygons.

Using USA Parking Lots you can quickly see which areas of your town or city have a high concentration of parking lots. You can then draw this area onto the Parkulator map to find out how many homes you could build in this area or how much parkland you could have if your city had better public transportation and dedicated bike lanes. 

Wednesday, October 05, 2022

Why Trump Voters Eat at Wendy's

The Washington Post's Department of Data has discovered a curious correlation between the number of chain restaurants in a state and the number of Trump voters. Apparently the state's with the highest percentage of Trump voters also have the most franchise foods.

The Department of Data obviously knows that correlation isn't causation and that a tendency to vote for delusional wannabe dictators is not a direct result of poor nutritional choices. They therefore went looking for correlations between chain restaurants and other data. 

In the article Places in America with the most chain restaurants the Washington Post has published a number of interactive maps. For example at the top of this post you can see a screenshot of the most common restaurant cuisine in each state. One of the most interesting maps in the article is a map of the percentage of workers who commute by motor vehicle in each U.S. county.

According to the Washington Post alongside the strong correlation of the number of chain restaurants and Trump voters there is also a strong correlation between the number of chain restaurants in a state and the number of people who commute by motor vehicle. They therefore conclude that Trump won more counties with a high number of chain restaurants because he 'won more of the places with the most car commuters'.

The Post doesn't draw any conclusions from this, saying 'We still aren’t sure why Trump won areas with more car commuters'. Personally I strongly suspect that it may be tied to the urban-rural divide in Democrat and Republican support which manifests in nearly every election (i.e. rural Americans are more likely to have to commute by motor vehicle that urban Americans). 

However the Post does have a good explanation of why there are more chain restaurants in areas with the most motor vehicle commuters. They explain how highways and chain restaurants have been closely linked since the earliest days of the interstate highway. 

Tuesday, October 04, 2022

Mapping the World's Public Transport

Transitland's Global Transit Map is an interactive map which shows the extent of public transport systems around the world. The map uses publicly available GTFS transit feeds to create a map of each city's transit systems.

Transitland aggregates feeds from over 2,500 operators in over 55 countries. However because transitland relies on the published GTFS feeds of public transit systems its coverage can be patchy or non-existent in some countries. 

Because GTFS has been widely adopted in the USA transitland can be used to compare the transit systems of American cities. For example in the screenshot above I have compared the public transport systems of Boston, New York, San Francisco and Washington D.C. (based on their published GTFS feeds).

Transitfeeds is another web service which aggregates the GTFS transit feeds of cities around the world. Both transitland and transitfeed provide their own APIs which allow you to programatically access their aggregated GTFS feeds. This means that you can use both transitfeed and transitland to download information on public transport systems around the world, including stop locations and route geometries.

Monday, October 03, 2022

Using CSS Filters for Custom Map Designs

Darren Wien's Mapbox Binoculars is a fun interactive map which gives you a view of planet Earth as it might appear standing on the Moon with a pair of binoculars. Using the map's binocular controls you can zoom in on any location and bring into and out of focus.

Sketchy Map is a new interactive map, from Steve Attewell, which (I think) uses a combination of Mapbox GL's custom styling and CSS filter effects to create an artistic hand-drawn 'sketch' effect. Using Sketchy Map you can zoom in on any location in the world (or use the search box) to view the location in this sketchy map style.

Sketchy Map includes a customizable heading overlay (in the screenshot above the heading reads '富士山' (Mount Fuji)). If you click on this heading in Sketchy Map you can edit the text to say anything you want.

You can view more CSS filter effects applied to an interactive map on Blurd. On this map CSS filter effects are applied to blur and unblur the map when you pan and zoom around the world. This is another experimental map from Darren Wiens. Both Blurd and Mapbox Binoculars use CSS filter effects to bring the map into and out of focus.

Steve Attewell has also used CSS filter effects in his Mapbox Camera Lens Effect map. This time CSS filters are used to create a tilt-shift effect and to apply a blur effect to the map. The map includes a button which allows you to turn the camera effect on & off.

I don't know for certain but I suspect that Mapbox Binoculars, Sketchy Map, Blurd and Mapbox Camera Lens Effect were all inspired by a recent Stamen blog post on applying CSS filter effects to interactive maps. In More Ways to Make Your Map Go Dark Mode Stamen explains how CSS filters can be applied to a map canvas to invert a map's colors.

You can view the outcome of Stamen's CSS filter experiments on their Invertorator interactive map. On this map CSS filters have been applied to the map canvas to invert every color on the map.

Brazil Election Maps

Neither of the two main Presidential hopefuls in yesterday's Brazilian election won enough votes to win outright. Luiz Inácio Lula da Silva, the candidate of the left, won 48% of the votes, while the far-right incumbent Jair Bolsonaro had the support of only 43% of the electorate. Because neither candidate reached 50% of the valid votes they will now face each other in a run-off election in four weeks time.

Bloomberg's Brazil Election Live Results includes an interactive map showing the results of yesterday's election in each state. On this map the winning candidate in each state is indicated by the color of a scaled circle. The size of each circle represents the number of voters in the state. If you hover over a state on the map you can view the number & percentage of votes cast for each of the candidates.

Brazilian newspaper Folha de S.Paulo has also published an interactive map of the results. Their Interactive Map of All Cities shows the results down to the city level. Both the Bloomberg and Folha maps reveal a rough north-south split in support for the two main candidates. The incumbent Bolsanoro won most of his seats in the south of the country, while ex-President Lula proved the most popular candidate in most cities in the north. 

The poorer northern regions of Brazil have historically voted in greater numbers for the candidates of the left. The Bloomberg map includes an option to compare this year's election results with the results of 2018 and 2014. This roughly north-south divide in support for the left and right parties is also apparent in the election maps for 2018 and 2014.
You can also see this rough north-south divide on Globo's Brazil Election Map. This interactive map of the Presidential election again shows the results for each individual electoral area. If you click on a seat on the map you can view the number and the percentage of votes made for each candidate.

Saturday, October 01, 2022

Exploring the Lakes of Mars

Freie Universität Berlin's Jezero Crater interactive map allows you to take a virtual tour of the landing site on Mars of the 2020 Perseverance rover. This tour includes a synthesized 360 degree panorama of the crater as it might have once looked, when water still existed on Mars. 

The interactive Jazero Crater map shows the track of Perseverance, revealing the parts of the Jezero crater which have already been explored by the Mars rover. The map also includes a number of synthetic and real interactive 'Street View' panoramas. The real 360 degree panoramas use imagery captured by the Mars rover to show the view from inside the Jezero crater. The synthetic panoramas have been rendered from orbital image data of Mars. 

The synthetic panoramas include one, labeled Paleo Lake View, which shows the crater filled with water. This recreation of how the crater might have looked when water still existed on Mars is based on 'putative paleolake-shorelines and the upper delta-top boundary'. The Paleo Lake View panorama and all the other panoramas  include  Martian soundtrack. This soundtrack was created using data from the air pressure sensor on NASA's InSight lander, to give an impression of the sound of wind blowing through the Jezero crater.


You can follow the Perseverance rover's continuing mission on the Mars 2020 Mission Tracker. The Mars 2020 Mission Tracker is a 3D interactive map of Mars, developed by the Spatial Studies Lab at Rice University, which is being used to track the Perseverance Rover on Mars. Using this 3D map you can follow the progress of the Perseverance Rover on Mars and view all the latest images captured by the rover and the Perseverance drone. 

NASA's 2020 Mars mission is examining the geology of Mars looking for the biosignatures of past microbial life on the red planet. In order to carry out this mission the Perseverance Rover is equipped with the Ingenuity helicopter drone. The Ingenuity drone is being used to help scout for points of interest for the Perseverance rover to investigate and study during its exploration of Mars.

The date control at the top of the Mars 2020 Mission map allows you to view the movements of the Perseverance Rover and the Ingenuity drone over the course of the mission's duration. If you select a date on this control the markers on the 3D map of Mars will show where Perseverance and Ingenuity were located on that day. When you select a day from the date control the image gallery also updates to display the images captured by the drone and rover on the selected day.