Mapping the Dutch Slave Trade

The Dutch Trade in Black People is a story map exploring the role of the Netherlands in the transatlantic slave trade. The story uses an interactive map to explain the triangular trade between the Netherlands, West Africa and the New World. The map is also accompanied by and illustrated with a number of contemporary paintings depicting enslaved Africans, the slave ships used by the Dutch and the slave plantations in the New World where enslaved Africans were forced to live and work.
The Dutch, and in particular the Dutch West India Company (WIC), played a large role in the slave trade. Between the 15th and 19th centuries around 12 million Africans were enslaved by Europeans. The Dutch were responsible for around 6% of that slave trade. During certain periods the expanse of the Dutch West India Company allowed the Dutch to play a far larger role in the slave trade. For example between 1650 and 1675 half of all the slaves transported between Africa and the new world were shipped by the Dutch.
As you progress through the Dutch Trade in Black People story map the interactive map is used to highlight locations important to the Transatlantic slave trade. For example it is used to show the west coast of Africa where the Europeans built forts and where enslaved Africans were housed before being transported to the New World. The map is also used to show some of the locations in the New World which played a significant role in the slave trade. For example, the island of Curaçao, which became an important station for Dutch slavers.
The triangular slave trade played a major role in the Dutch economy for over two centuries. Ships from the Netherlands traveled to West Africa with weapons, ammunition, liquor and textiles. With this merchandise the slavers bought enslaved Africans. The ships then transported these slaves to the new world where the slaves were then sold. The slave ships were then packed with sugar, coffee, cotton, cocoa or tobacco from the plantations and then returned to the Netherlands.

You can get a better understanding of this huge triangular slave trade network between Europe, Africa and the New World by exploring Slave Voyages. The Slave Voyages website maintains databases of the Trans-Atlantic and Intra-American slave trade. These databases include information on 36,000 slave trading voyages from Africa to the New World carried out between 1514 and 1866; 11,000 voyages from one part of America to another; and personal details about 91,491 Africans who were forced into the slave trade.
Slave Voyages provides an introduction to the Trans-Atlantic slave trade using a series of static maps. These maps are from the Atlas of the Transatlantic Slave Trade and help to illustrate the trade routes used to transport slaves, the countries involved in organizing the trade and the volume of people traded. A Timelapse animated map also plots 14,289 slave voyages crossing the Atlantic over time. This map shows the actual journeys of slave ships from Africa to the Americas by year. It provides a sharp illustration of the sheer scale of the slave trade.
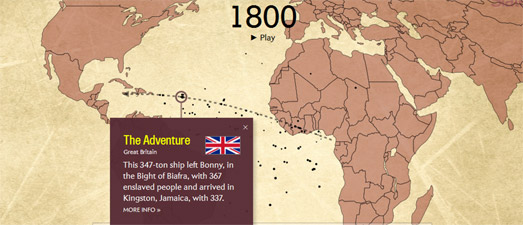
This isn't the only mapped visualization of the Transatlantic Slave Trade Database. In 2015 Slate released the Atlantic Slave Trade in Two Minutes, a map which also animates the journeys of slave ship journeys over a period of 315 years. Slate's map reveals the patterns of the trade routes used and the destinations of the slave ships. The size of the ships on the map are scaled to represent the number of slaves on board. You can also click on each ship to find out under which country's flag a ship sailed.


Comments