Raster Rivers & Railways
Most of the major interactive map providers, such as Google Maps and Bing Maps, are vector maps. However they didn't begin as vector maps. Both Google Maps and Bing Maps began life as raster maps.
A raster map is a map which is made from lots of static map images. An interactive raster map is essentially a tiled grid of lots of different images, each containing a different part of the map. When you zoom in on an interactive raster map new more detailed map images are loaded into the map.
On the other hand, in very simple terms, a vector map uses map data rather than static images. Map features such as building footprints, roads, rivers, elevation etc. are all served as different types of data. A vector map is basically a database of points, lines and polygons. Other types of information can be assigned to this data, such as the height or the age of a building. This makes vector maps very useful for analyzing and visualizing geographical data.
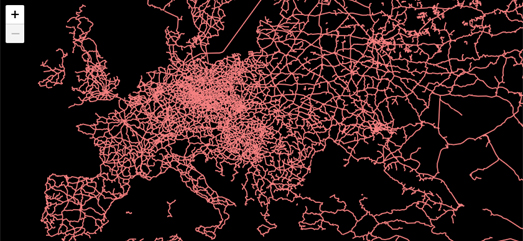
Today's #30DayMapChallenge is to create a raster map. Lyzi Diamond of Glitch has created a raster map of Global Rail Lines. The map was made for day two of the challenge, which was to make a map with lines. However the Global Rail Lines map is also a great example of a raster map. The map uses data from Natural Earth to show only the world's railways.
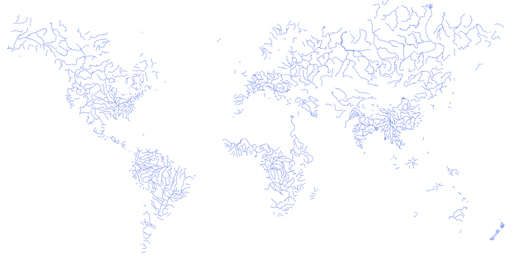
I followed the same process as Lyzi took to create my own raster map. My World Rivers map is an interactive raster map which shows only the world's rivers and no other geographical features. Like Lyzi I got my 10m railway data from Natural Earth. I also updated the data into Mapbox Studio to create a map style and then used the Mapbox Static Tiles API to serve the raster map tiles to my Leaflet.js powered interactive map.


Comments