The Distressed Communities of America
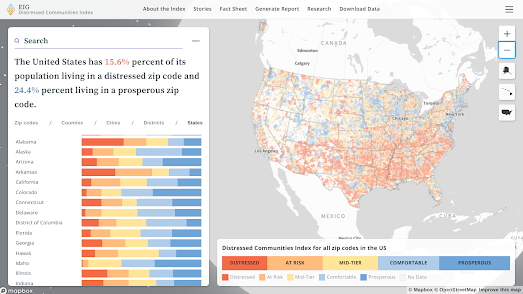
The Distressed Community Index from the Economic Innovation Group reveals the levels of economic well-being in all US neighborhoods. The Index uses seven different metrics to give every zipcode area a score out of 100, ranging from the most prosperous (0) to the most distressed (100).
You can explore which neighborhoods in your city are the most and least distressed on the 2024 Distressed Community Index Interactive Map. On the map individual zipcode areas are colored by their DCI rank. If you select an individual zipcode area on the map then the information window updates to reveal how the area scores in each of the seven different DCI metrics. The information window also compares how the selected zipcode area compares with all the other zipcode areas in its state.
The 2024 DCI map is based on data from 2017 to 2021. According to Axios the data reveals that the "share of people living in prosperous communities has risen most in the mountainous states of the West, most notably Idaho, Montana and Utah. By contrast, Louisiana, Oklahoma and New York state showed significant growth in the share of the population living in distressed ZIP codes".
The DCI interactive map also includes a number of 'stories' which explore different aspects of well-being revealed by the data. These include an analysis of life expectancy in different areas of the US, and how inequality can be masked at the county level.


Comments