Mapping 100 Years of Tornado Data
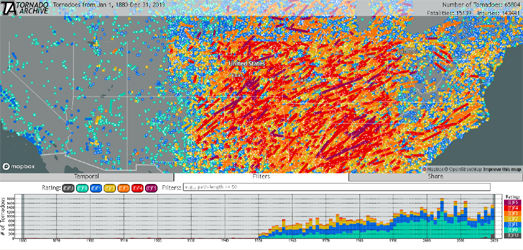
The Tornado Archive is an interactive map which visualizes over 100 years of tornado data. The map uses historical weather data from a number of different sources, including the Storm Prediction Center, StormTrack and the National Weather Service.
The Tornado Archive interactive map includes a useful filter tool which allows you to explore the historical tornado data using a number of different variables. These include path length, path width, fatalities, injuries or state. You can use these filters to create very detailed searches. For example, visualizing all tornadoes over 50 miles in path length in Kentucky.It is possible to refine a search even further by using the 'Temporal' search tool. This tool allows you to refine the tornado tracks shown on the map by a date or date-range.
The tornado tracks shown on the map are colored by their rating on the Fujita Scale. If you click on an individual tornado track on the map you can view details on that tornado's date, location, strength, and the number of casualties and fatalities (if any).

You can also view historical tornado data on the
Tornado Tracks Tool interactive map from the Midwestern Regional Climate Center. This map visualizes the path of every tornado in the United States since the middle of the Twentieth Century, using data from the National Weather Service Storm Prediction Service.
You can filter the tornadoes shown on this map by scale, by year range and by the number of casualties caused. You can also select an individual tornado track on the map to view its strength, date, length & width and the number of injuries & fatalities.


Comments