Natural Gas Flaring Map
The SkyTruth Flaring Map visualizes daily infrared detections of oil wells around the world burning off excess gas. Flaring from natural oil wells is a huge contributor to global heating. For example in 2018 145 billion cubic meters of natural gas was burned during flaring. That is the equivalent of the entire gas consumption of Central and South America combined.
The SkyTruth Flaring Map uses data detected by NOAA’s Suomi NPP satellite. The map is updated daily to show all infrared detections hot enough to be gas flares. The map animates through these nightly detections of global flaring. The animation can be controlled using the timeline tool in the map sidebar.
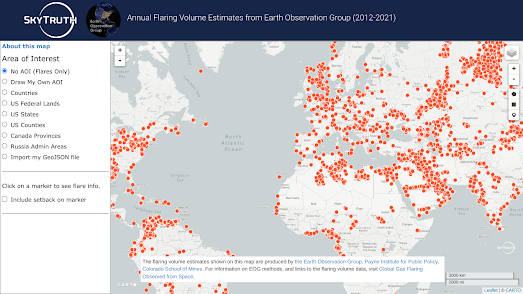
SkyTruth has also released an Annual Flaring Volume Map. This map shows the annual volume estimates of gas flaring maintained by the Earth Observation Group.
On this map oil refineries around the world are shown using a red marker. You can click on the individual markers to view the estimated volume of gas flared and the detection frequency. The map includes drawing tools which allow you to create your own areas of interest on the map to view (and download) the flaring data for only the refineries in your defined area.


Comments