Mapping Police Killings
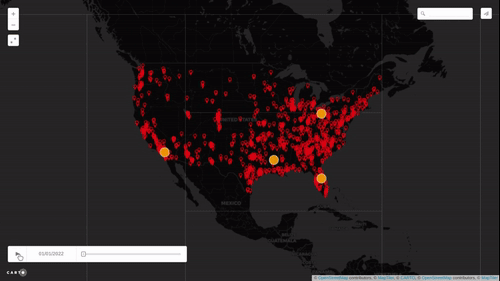
The animated map above shows people being killed by the police over the course of 2022. 1,176 people in the United States were killed by the police last year. That means that on average 3.2 people a day were killed by the police during 2022.
The map and the data comes from Mapping Police Violence. Mapping Police Violence collects and publishes data on police violence across the United States. Unfortunately they aren't very good at mapping. The animated map shown above, which visualizes police killings in 2022 by date and place, has been produced to convey the scale of police violence against U.S. citizens. However it isn't very effective at showing the per capita rate of police killings across the country.
The Cities page on Mapping Police Violence does provide graphs which allow you to compare the rate of police killings by population in major U.S. cities. This data seems to suggest that the St. Louis Metropolitan Police Department has lost complete control. The St. Louis Metropolitan Police Department rate of 15.9 killings per 1m (2013-2022) is way ahead of the Tulsa Police Department, who have the second highest rate (9.4) of police killing of American police departments.


Comments