Dot Maps of the Chicago Mayoral Race

Brandon Johnson is set to become the new mayor of Chicago. Johnson beat Paul Vallas in Tuesday's runoff election with 51.44% of the vote. You can see where people voted for each of the candidates at the neighborhood level thanks to two different dot density maps created from the results of the Chicago Mayoral election.
CBS in Breakdown of Chicago mayor vote by precinct has created a combined dot density map which uses different colors to show where votes were cast for each of the two candidates. In this map (pictured at the top of this post) Brandon Johnson votes are shown with green dots and Paul Vallas votes are shown in pink. As you can see from the map Paul Vallas did well in many northern and south-western electoral precincts. Brandon Johnson performed better in the West Side and in many of the southern neighborhoods.
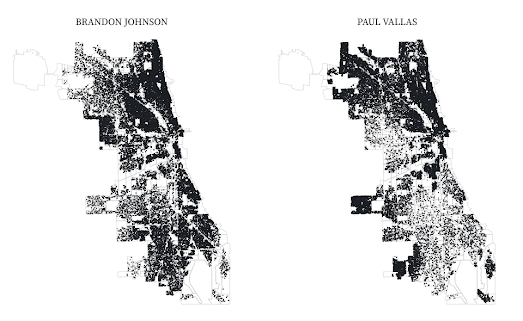
Forest Gregg has also created two dot density maps of the mayoral election. His Observable maps 2023 Mayoral Election Runoff, Dot density maps use black dots to represent 10 votes cast for each candidate. Forest has created a separate dot density map for each candidate. With the two maps placed side-by-side it is easy to see where in Chicago each candidate performed best
If you want to know exactly how many votes were cast for each candidate then you can view this 2023 Chicago Mayoral Runoff map. This map colors each precinct to show which candidate won the most votes. You can hover over the individual precincts on the map to view how many votes were cast for each candidate.
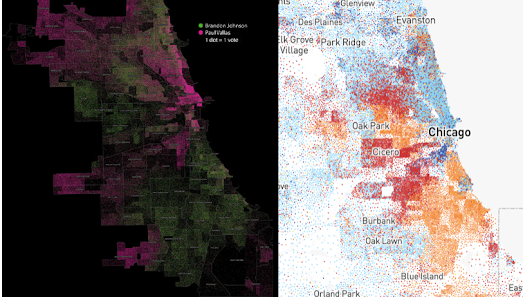
It is always interesting to compare election maps with maps of other metrics. CNN's Racial Dot Map of the U.S. provides a neat visualization of the racial demographics of Chicago neighborhoods. The image above shows CBS's dot density map of the mayoral election side-by-side with the racial dot density map of Chicago. On this later map light blue dots are white, orange dots represent Black citizens and red dots indicate Hispanic residents.
A very rough comparison of the two maps suggests to me that Black majority neighborhoods tended to vote for Brandon Johnson, while many of the white majority neighborhoods voted for Paul Vallas.
Comments