Trees are Moving North
In the last few years, in response to global heating and climate change, a number of interactive maps have been created which attempt to show how temperatures in your home town will change over the course of the 21st Century. The traumatic climate changes that we are beginning to experience will have a huge impact on our local ecosystems, effecting the natural habitats of our native flora and fauna.
The Washington Post has decided to map out how global heating will affect the habitat ranges of trees in the United States. As the United States warms the ranges of tree species in the U.S. are beginning to drift northwards. In Trees are moving north from global warming the Post has created a series of maps which show the future growing ranges of American trees.
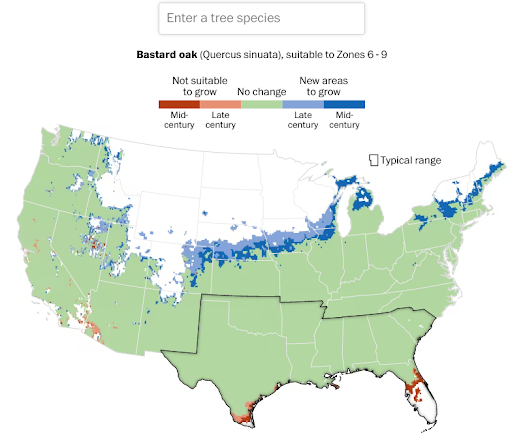
The Post's article starts with an animated map which shows how plant hardiness zones are likely to drift northwards over the course of this century. As these zones move north the habitats of individual tree species will also migrate northwards. The Post article includes an interactive map which allows you to enter the name of a species of tree to view how its growing habitat is likely to change over the course of the next 80 years. In most cases the southern edges of a species' hardiness zone will become inhabitable due to global heating and the species will become more suited to more northern latitudes.

Survival by Degrees: 389 Species on the Brink includes a number of different maps which allow you to find out which birds are at risk in each state and the predicted climate effects on each species of bird. The individual maps for each bird species show the current habitat range of the species. These maps allow you to view how the bird's range will be affected by different global heating scenarios. Under each of these scenarios the map shows where range will be lost and gained and provides an overall vulnerability status for the species.


Comments