The Migratory Journeys of Birds

eBird collects and documents data on bird distribution, abundance, habitat use, and trends. It has detailed information on more than 1,000 bird species around the world. This week eBird has updated its Bird Status maps so that they are now all interactive.
Select a species of bird on the eBird Status and Trends webpage and you can view an interactive map which shows the species' 'Abundance', 'Range' and 'Habitat'. If you select the 'Weekly' option you can actually watch an animated map showing the species' relative abundance for every week of the year, revealing the species' migratory patterns.

If you are interested in bird migratory journeys then you can dive deeper into different bird species abundance patterns on eBird's Abundance Animations page. This section of the eBird website provides examples of abundance animations for a number of different bird species. For example the animation above shows the weekly abundance of the Gray-cheeked Thrush over the course of one year. Gray-cheeked Thrushes migrate to northern South America in winter. They then spend the summer months in Alaska and Canada.

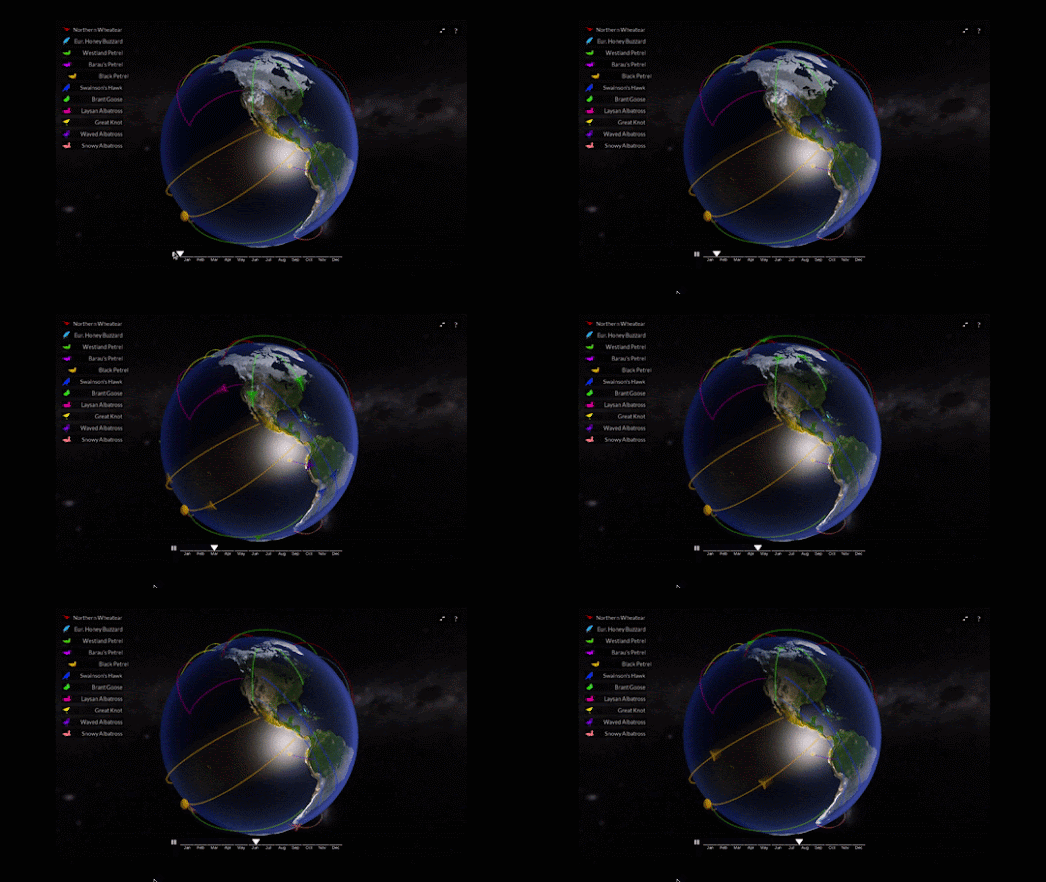
The Globe of Bird Migration is a mapped visualization of the migratory paths of 11 different species of birds around the world. The simplified migratory paths of each of the 11 bird species are animated on a 3d globe over the course of twelve months.
You can select to view the path of any of the 11 species using the menu on the left of the globe. When you select a species from the list you can view a few details about the birds' estimated population and conservation status. You can also discover where it breeds and winters and how far the species migrates.
The 3d globe was custom coded for the visualization using the Unity WebGL engine and 3DS Max.

Comments