Welcome To Your New Gardening Zone
In November of last year the US Department of Agriculture (USDA) updated the US plant hardiness map based on the latest weather data (1991–2020). The USDA Plant Hardiness Zone Map is a tool which is designed to help gardeners determine which plants are most likely to thrive in their location.
The USDA map is divided into 13 zones based on average coldest temperatures. Zone 1 is the coldest zone, with average annual minimum temperatures below -55°F, while Zone 13 is the warmest zone, with average annual minimum temperatures above 65°F.
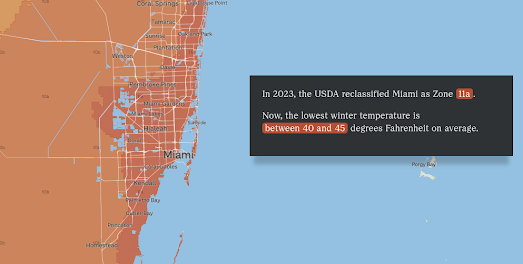
NPR has released a new interactive map which allows gardeners to discover their new plant hardiness zone and what this means for their gardens. Enter your location into the article, The USDA’s gardening zones shifted. This map shows you what’s changed in vivid detail, and NPR will show you your new plant hardiness zone, and the lowest average temperatures in your zone. The map will show you how much warmer this is than your previous average lowest temperatures.
As well as allowing you to discover your new Plant Hardiness Zone the NPR article does a very good job at explaining what the zones do and don't tell you about the kinds of plants that you can and can't grow in your garden. It explains how different locations within the same zone can still have widely different climate conditions which can affect which plants will thrive in your particular garden and climate.


Comments