Mapping the World's Power Plants
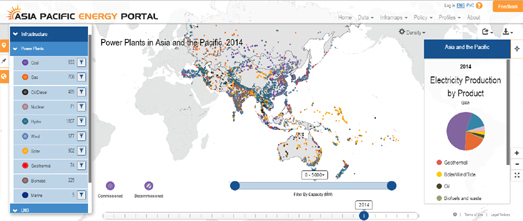
Over 50% of electricity in the Asia-Pacific region comes from coal fueled power plants. The next biggest source of electricity is natural gas, which produces 17.9% of the region's electricity. The renewable energy power sources of solar, wind and tide only contribute 3.99% of the region's electricity.
The Asia Pacific Energy Portal has released an interactive map which visualizes over 7,000 power plants in the Asia-Pacific region. The map allows you to filter the power plants shown on the map by type. It is therefore possible to see where different types of plant are located. You can also filter the power plants shown on the map by capacity. For example you can select to view only coal powered plants with a capacity over 4,000 MW. Do this and you will see that China has nearly all the huge coal fueled power plants in the region.
Coal is still the main source of energy for the USA. However, despite President Trump's campaign promises, the use of coal continues to fall. The consumption of coal during 2018 is expected to be the lowest in 39 years.
You can explore America's power supply on the U.S. Power Plants map. U.S. Power Plants is an interactive map showing the locations, size and type of America's electric power plants. The map is a great way to see where different types of power plant are located, how much each type of energy source contributes to the country's power supply and how much each source contributes to CO2 emissions.
The number of map filters on U.S. Power Plants means that the map can provide lots of different insights into American power supply. For example the individual fuel filters allow you to see where different power sources are concentrated in America. Select hydro power and you can see that hydro power plants are concentrated in the north-west and north-east of the country. While solar power plants are mainly located in California.
If you click on an electricity power plant marker on the map you can view details on the plant's capacity, net generation and CO2 output. The drop-down menu also allows you to re-scale the map markers by the amount of CO2 produced by each power plant.

Burning coal is the biggest single contributor to global warming. Instead of reducing our use of coal we have decided to double its use. According to Carbon Brief "since 2000, the world has doubled its coal-fired power capacity". Current plans for new coal power plants around the globe will double that capacity once again.
Carbon Brief has mapped all the coal power plants in the world. The World’s Coal Power Plants interactive map is an effective and shocking visualization of the increasing use of coal around the world. It shows all the coal power plants around the globe operating in each year between 2000 and 2017. It also shows all the locations of planned new coal plants.
The accompanying chart reveals the source of all this new coal power capacity. China is almost single-handedly responsible for the huge increases in coal power in recent years. However, according to Carbon Brief, in response to air pollution and climate concerns there is some evidence that China's coal power production may have peaked.
Carbon Brief has also mapped The World's Nuclear Power Plants. This interactive map shows the locations of the world's 667 nuclear power stations. The map shows the location, operating status and the generating capacity of every nuclear reactor in the world.
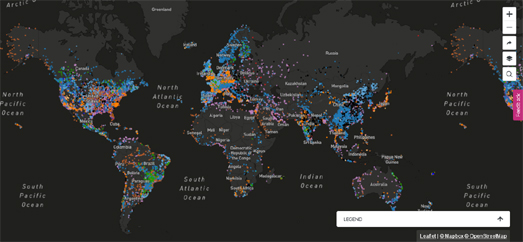
You can also use the Resource Watch interactive map to view all the power plants in the world. Resource Watch includes a Global Power Plant Database layer which is a comprehensive, open source database of power plants across the globe. The map layer includes around 28,500 power plants from 164 countries.
If you select individual power plants on the map you can view information on the plant's power capacity, ownership and fuel type. Unfortunately it isn't possible to filter the Resource Watch map by power plant type or capacity. However the database is open source. This means that there is every chance that someday soon someone will download the data and create an interactive map which permits users to filter & query the power plant data by fuel type and by the capacity of power plants.


Comments