The World's Largest Polluters
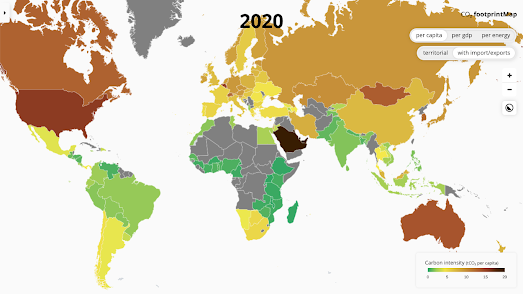
The footprintMap is an interactive mapped visualization of the CO2 footprint of 118 countries around the world. Using the map you can discover the per capita CO2 output of each country and see which countries contribute the most and least to global heating.
According to this map Singapore has the highest per capita CO2 footprint of any country. The United States has the 9th highest per capita CO2 footprint of the 118 countries featured on the map. Malawi, Uganda and Rwanda (respectively) have the lowest per capita CO2 footprint of the 118 countries.
The carbon data for the map comes from the BP Statistical Review of World Energy 2022 and the Global Carbon Budget 2022. The population and GDP used on the map is derived from the Worldbank.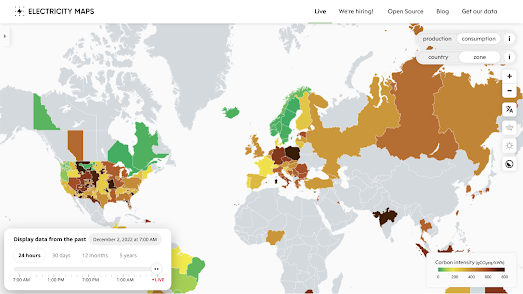
The footprintMap was created by Electricity Maps. Electricity Maps is a real-time map of electricity production around the world. The map uses data about electricity production and consumption from energy producers and government agencies across the globe to provide a near real-time dashboard of the live CO2 emissions and electricity consumption of individual states and countries.
Each country and state on the live map is colored by how much CO2 is used to produce its electricity demand. If you hover over a country or state on the map you can view the percentage of its electricity which is low carbon or from renewable sources. If you click on a country or state then you can view a breakdown of how its electricity demand is met. For example, how much electricity is produced by wind, solar or hydro power plants.


Comments