Friday, December 30, 2022

A Little Map Fun x 3

If you want to celebrate New Year's Eve in style then you should boogey on down to the Map Disco. The animated GIF above really doesn't do Map Disco justice - because this GIF is missing sound. Visit Map Disco yourself and you can watch the countries of the world lighting-up to the amazing sounds of the Bee Gee's classic 'Staying Alive'.

Slightly more ambient sounds can be enjoyed on Steve Attewell's Camera Lens Effect map. This interactive map presents a view of the world as seen through the lens of a camera (complete with raindrops hitting the lens). But that's not all. The Camera Lens Effect map also comes with ambient sounds. Zoom-in on the map and you can hear the sounds of the city streets. Zoom-out and you begin to hear more natural sounds, such as the noise of the jet stream. 

Even more map fun can be found on the Kaleidoscope interactive map. This map stitches together a number of different map views (flipped & rotated) to create a psychedelic map kaleidoscope. If you open the control panel you can even adjust the number of map instances used in the kaleidoscope.

Thursday, December 29, 2022

The 50 Best Maps of 2022

Maps of the Year is my round-up of the top 50 interactive maps of 2022.

The maps listed in this round-up are the 50 interactive maps which made the biggest impression on me over the last 12 months. As such they probably reflect my personal interests as much as they do any developing trends in digital cartography.

I am struck by how many 3D maps of historical monuments or places appear on my personal Maps of the Year list. Some of these reconstructions might even be considered more 3D models than 3D maps. The preponderance of these reconstructions or maps of historically important locations reflects my own interest in digitally reconstructing lost locations and being able to virtually visit world hertitage sites.

If I was forced to choose my own personal favorite map of the year I would choose Getty's amazing 3D reconstruction of an ancient lost city, Persepolis Reimagined. For years I have dreamt of being able to virtually walk around digital reconstructions of ancient Rome,  Pompeii, medieval London, or gold-rush era San Francisco. Persepolis Reimagined proves that it is now possible to actually create fantastic digital models or maps of historically important locations and cities.

Unlike Persepolis some fantastic artefacts from ancient history still survive. The Pyramids Of Meroe and Digital Giza use 3D modeling, photogrammetry and panoramic imagery to provide incredible 3D virtual tours of globally important historical monuments that very few of us will ever get to visit in person. Both of these virtual tours came very close to pipping Perspolis Reimagined as my personal Map of the Year.

My favorite map of 2021 was Sam Learner's River Runner. It is no surprise to me that his River Runner Global Edition also features on this year's round-up of the best interactive maps.

And, if you are suffering from an extreme case of epistemological shock at all the non-maps in my list of the Best Maps of 2022, then you might want to visit Kenneth Field's selection of his Favorite Maps of 2022.

Friday, December 23, 2022

Mapping Street Orientations

The animated maps above compare the extreme grid like layout of Chicago to the more organic street layout of London. As both maps move the attached compass roses update to show the orientations of all the roads in the current map bounds. 

The two maps were taken from The Economist's The Decline of the City Grid. This article also includes an interactive map which allows you to enter the name of any town or city to view a compass rose visualizing the location's predominant street orientations.

The Economist's article acknowledges its debt to Geoff Boeing's work on Comparing City Street Orientations, in which he compared the street orientations of 100 cities around the world. Geoff's study and his compass rose visualizations of predominant street orientations also inspired Mapbox's Vladimir Agafonkin to create his interactive Road Orientation map.

I suspect that The Economist has reused Vladimir's road-orientation-map code. I have used Vladimir's code myself many times (for example to map airport runway and church orientations). The code is very easy to adapt for different map features. I explain a little how you can adapt the road-orientation-map code in this post The Streets and Avenues of New York (which uses the code to just show the alignment of all the roads named 'Avenue' and  all the roads named 'Street' in New York).

Thursday, December 22, 2022

The A-A Christmas Quiz

Today I've been preparing my contribution to the annual Clarke Family Christmas Quiz. My map quiz requires you to name 8 countries based on each country's map outline. The name of each of the 8 countries begins and ends with the letter 'A'.

Although there are only 8 countries to name and although you know the first and last letter of each country I think this quiz is still very difficult. If you need a little help then this Wikipedia list of countries beginning with the letter A might be useful.

America, Antarctica, Africa, Asia, and Antigua (& Barbados) are not the answer to any of these country maps.

If the image above is a little unclear or if you want a print-out then you can download a PDF of the quiz - A to A (PDF file download).

The country border outlines for the quiz all came from World countries in JSON, CSV and XML and Yaml.

Disclaimer: I've definitely seen someone else mapping all the countries in the world which begin and end with the letter 'A'. Unfortunately I can't remember where I originally saw this. It could well have been one of the maps created for this year's #30DayMapChallenge. 

Mapping the Ancient Silk Route

The China National Silk Museum has created an interactive map which plots the technological advances in silk production over a period of around 6000 years. The Jinshow World Silk Interactive Map is the pilot project of a planned Interactive Atlas of Silk Roads. The initial world silk map plots the locations of over 12,000 artefacts related to the technological evolution of the production of silk and allows users to explore the development of materials and techniques in silk production over 6,000 years history.

The main Jinshow World Silk Map shows where archeological artefacts related to the production of silk have been discovered. These artefacts may be related to the developing technologies used in the production of materials, dyes and fibers. The map includes an interactive timeline which allows you to filter the archaeological discoveries by date.

The Jinshow World Silk Map also includes a number of maps exploring the Spatio-Temporal Evolution of silk production. This consists of four separate maps which plot the evolution of 'fibers', the 'primitive loom', the 'treadle loom' and 'dye'. These four maps all include a timeline navigation control which you can use to view the chronological development of these four separate areas of silk production.

Wednesday, December 21, 2022

Santa's Map of the World

A World of Good Wishes at Christmastime is a pictorial map which was published by the General Drafting Company in 1950. The map shows Santa Claus participating in a range of 'local' activities around the world. 

As you might imagine the map relies on a number of perceived Western stereotypes. For example in Scotland Santa is depicted playing the bagpipes, in Australia he is seen boxing with a kangaroo, in India he is charming a snake and in Spain he can be seen fighting a bull. 

The General Drafting Company was one of the three big road map publishers in 20th Century America. They were the exclusive publisher of maps for a number of oil companies. The map 'A World of Good Wishes at Christmastime' however appears to have been published under the General Drafting Company's own name and I imagine was produced to promote the company and perhaps to be sent to customers and prospective customers as a kind of map themed Christmas Card.

My interactive version of A World of Good Wishes at Christmastime was created using the IIIF Manifest of the copy of the map owned by the American Geographical Society Library Digital Map Collection at the University of Wisconsin. You can also view an interactive version of the map on the library's website.

Another fun Christmas themed map is the Smithsonian Folkways Holiday Music Map. This musical map is bursting with traditional holiday music, featuring songs from the the museum's Folkways Recordings collection. 

The map includes 56 songs in total from 24 different nations. These are songs which celebrate the winter holidays, whether that be Christmas, Chanukah, or Kwanzaa. Using the map you can listen to an Icelandic version of 'Silent Night', 'O Tannenbaum' from Germany, 'Psalm 150' sung by the Jewish Abayudaya congregation in Uganda or traditional Christmas songs from many other country's across the world.

Every Christmas Eve you can track Santa's journey around the globe on Google's annual Santa Tracking map. However you don't have to wait until Christmas Eve to visit the Google Santa Tracker. Every day, between now and Christmas Eve, the Google Santa Tracker will feature a different Christmas related game.

The Google Santa Tracker also includes a Google Map looking at Christmas Traditions across the world. It is always fascinating to explore how different cultures celebrate Christmas around the globe. For example did you know that in Iceland the Christmas Cat prowls the streets at Christmas gobbling up anyone who is not dressed-up in clothes warm enough to ward off the winter cold?

Tuesday, December 20, 2022

Mapping Segregation in the United States

Yesterday the Washington Post published an article exploring the lasting legacy of racial covenants. These 'racial covenants' were clauses which were written into property leases or deeds prohibiting them from being sold or rented to people not "of the Caucasian race." The article Historians Mapping Racial Covenants links to interactive maps created by Montogomery County Planners, by the University of Minnesota and in Washington DC.

The University of Minnesota's Mapping Prejudice includes an animated map which shows the spread of covenants over time in the city of Minneapolis. The 'timelapse' map shows the growth of the number of buildings in the city placed under racial covenants from 1911 to 1954. As the map plots covenants added through time you can see how whole neighborhoods are essentially segregated as more and more buildings in the city are given racial covenants.

Mapping Segregation in Washington DC is an interactive map which visualizes all the homes in the capital which have had racial covenants. The project has also created a number of story maps which explore in more detail the impact and historical legacy of racial covenants in the city. 

The Planning Commission of Montgomery County has also produced an interactive map which explores both historic redlining and the use of racial covenants in the county. Their Mapping Segregation Project looks at the history of segregation in Montgomery County. The project hopes to "explain how ... institutionalized and systemic actions led to the inequitable development of Montgomery County." The current interactive map is a working draft of this ongoing project to map the county's racial restrictive covenants and HOLC loans (redlining).

You may also be interested in:

Monday, December 19, 2022

The American Illiteracy Map

ProPublica has mapped out the levels of adult illiteracy across the United States. 23% of adults in the United States struggle to read. However the levels of adult illiteracy are not the same across the whole country. Because the U.S. has one of the most unequal education systems of industrialized countries race and income have a huge impact on adult literacy rates.

An interactive map in the article Why America Fails Adults Who Struggle to Read shows the percentage of the adult population who struggle to read in every county in the country. The map shows quite a stark north-south divide. The black belt and southern Texas particularly stand out as areas with very high levels of adult illiteracy.

The ProPublica article focuses on how adult education is failing to address America's poor literacy levels. Much of this is due to systemic failures in an adult education system which prioritises advanced students and is less interested in providing literacy education. 

Part of the geographical differences in adult literacy may also be due to the variations in state funding for adult education. The ProPublica article lists each state's funding level for adults per eligible adult. Connecticut tops this list with $149 per eligible adult. Nebraska has the lowest level of funding for adult education with just $2 per eligible adult (although Nebraska appears to have comparitively low levels of adult illiteracy - with most counties falling far below the 23% national average of adults struggling to read).

Saturday, December 17, 2022

Scrolling the Mekong River

Reuters has created a very impressive scrollytelling map which is being used to illustrate how dams are having a devastating impact on the farms and livelihoods of people living on the Mekong River Delta. 

In How Dams Starve the Mekong River of Vital Sediment Reuters explores how the construction of hydroelectric dams has blocked the flow of sediment in the Mekong River. Sediment which is needed to provide nutrients for the rice farms along the delta. These rice farms help to feed up to 200 million people across Asia.

An impressive scrollytelling map is used to show the location of operational dams and the dams which are planned to be built in the future. As you scroll through the article the map scrolls down the Mekong River, while small info windows provide information on the hydroelectric dams and their devastating impact on those who rely on the river and its floodplains for their livelihoods. 

As you scroll along the river you travel from Tibet, through China, Laos, Thailand, Cambodia, and Vietnam to the South China Sea. Because of the Chinese-built hydroelectric dams only about two-thirds of the silt which once flowed into the Mekong River Delta is now arriving. In 2007 around 143 million tonnes of sediment reached the delta. It is estimated that at the current rate of decline less than 5 million tonnes will reach the delta annually by 2040. 

Friday, December 16, 2022

The Average Color of the United States

The map above shows the color of soil across the United States. The image comes from the University of California's Soil Properties map, which shows the color of moist soil at different depth levels across the whole country. 

Soil color can tell natural scientists a lot about a landscape’s recent and long-term history. It can also provide clues about mineralogy and about where organic matter has accumulated. The color of the soil can also help scientists determine what types of soil can be found at different locations.

The Soil Properties map doesn't only show the color of moist soil at different depth levels. The interactive map also includes many other map layers which provide information on the chemical properties of soil across the United States, information on soil depth & erodibility, and the sand, silt and clay properties of the soil.


The animated map above shows the average color of the USA throughout the year as derived from Sentinel 2 satellite imagery. The map was created by Erin Davis. If you visit Erin's post the Average Seasonal Color of the USA you can view 35 separate maps showing how the average colors of the USA change over the course of a single year.

Erin has also published a series of interesting maps showing the average colors of countries around the world based on Sentinel satellite imagery. The Average Colors of the World includes maps of each continent and a map of the world on which each country is colored based on its average satellite color.

Thursday, December 15, 2022

Why India is Warming More Slowly

This week the Washington Post took a closer look at the surprising reasons parts of Earth are warming more slowly. The article starts with an animated globe which spins to identify three locations, East Antartica, India and the North Atlantic, where heating is happening more slowly than elsewhere.

Since the middle of the 20th Century the Earth has warmed by around 1.1 degrees Celsius (2 degrees Fahrenheit). However in parts of India, East Antartica and the North Atlantic temperatures have not risen at the same pace. Ironically the reasons that these areas of the world are not experiencing the same degree of global heating as elsewhere is because of human pollution and climate change.

The Washington Post article examines the reasons why the three identified locations are seeing slower than average warming. For example, the depleted ozone layer over East Antarctica means that it is less protected from the sun's ultraviolet light. In India high levels of air pollution contribute to higher than normal levels of fine particulate in the air, blocking and scattering sunlight. In the North Atlantic the melting of Greenland's ice is leading to the cooling of the ocean and tovdecreasing salinity.

Wednesday, December 14, 2022

2022 - A Year of Global Heating

This map animation shows global land and sea temperature anomalies for each month of 2022 compared to average temperatures (Jan-Oct as data for Nov & Dec has not been released yet). The red areas on the maps show where temperatures were above average for the time of year and the blue areas show where temperatures were below average.

The number at the top-right of each map is an estimate of the global mean anomaly. It shows how much hotter the world was on that month compared to the average. The base temperatures for this map were taken from 1951-1980. Both the colors on the map and these global mean anomaly figures are very alarming, showing a year of severe global heating.

The map was created using NASA's GISS Global Surface Temperature Analysis map. The GISS Surface Temperature Analysis is an estimate of global surface temperature change based on data from meteorological stations and historical records.

NASA uses the GISS Surface Temperature Analysis to create their own mapped visualizations. The video above visualizes the 10-Year Mean Anomaly, 1880-2021. Beginning with the 1880-1889 mean calendar year anomaly and ending with 2012-2021 the map shows how and where around the world temperatures differed from the average in each decade. Notice the rapid increase of global heating from the late 1980's onwards.

According to the World Meteorological Organization (WMO) the "global mean temperature in 2022 is currently estimated to be about 1.15 [1.02 to 1.28] °C above the 1850-1900 pre-industrial average". This means that in the past eight years we have lived through the eight warmest years on record. 

In response to this ever increasing climate crisis we continue to increase our emissions of greenhouse gases. The WMO's Provisional State of the Global Climate 2022 storymap reports that Carbon Dioxide, Methane and Nitrous Oxide emissions all continue to rise. 

As we continue to pollute the planet and the planet continues to heat we can expect to experience ever more extreme climate events around the world. The WMO's annual report includes an interactive map which plots extreme climate events which occurred during 2022. These events include the extreme flooding in Pakistan & Australia, the extreme heatwaves experienced in Europe and the extreme droughts seen in many areas of the world this year.

Trends suggest that 2023 will probably be even worse. With an even hotter global mean temperature and many more extreme climate events.

Tuesday, December 13, 2022

How to Make a Building Age Map

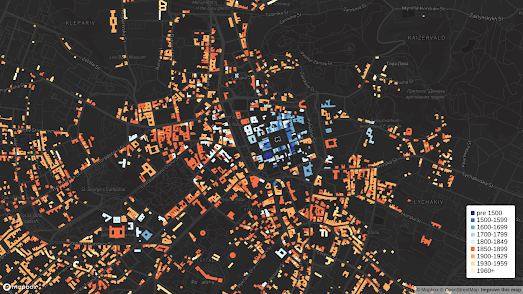
Earlier this month OpenStreetMap contributor SK53 posted an interesting tutorial on how to Color Code Buildings by Age in Overpass Turbo. The tutorial includes a link to this query in Overpass Turbo which when run will color all the buildings in the current map view by their year of construction.

Using this query you can quickly view the age of buildings anywhere in the world. Unfortunately OpenStreetMap doesn't actually have much building age data in most locations around the world. This means that in many towns and cities only a few buildings will be colored on the map. Some cities however do have a lot of building age data. For example OSM editors in Lviv, Ukraine have used city data to add the year of construction to many Lviv buildings on OpenStreetMap. 

This means if you run this query you can view a map of Lviv with the buildings color-coded by their year of construction. Press 'Export' and you can also download the data in GeoJSON format. Which is what I did to create my Lviv Building Age map.

To create this map I simply uploaded the exported GeoJSON file into MapBox Studio. I then used data conditions to style each of the building polygons in the GeoJSON file by the 'start date' for each building. So far the only thing that I have added to this map is a legend which shows the date range used for each color.

TO DO

1. Add some interactivity to the map - so that if you click on a building you can view its actual year of construction. If you now hover over a building footprint its year of construction will be displayed on the map.

2. Add interactivity to the map legend so that you can filter the buildings shown on the map by date range.

Monday, December 12, 2022

Land Doesn't Vote

After nearly every U.S. election a Republican will produce a map of the USA with electoral districts colored to show the winning party. This map is normally accompanied by a claim that the Unied States is a majority Republican country. Democrats will then reply with the traditional response, 'Land doesn't vote. People do.'

The problem with using a traditional geographic map to visualize election results is that they can be misleading, giving much more visual weight to large rural electoral districts at the expense of smaller urban districts. Instead cartographers and data visualization practitioners will often use cartograms to visualize election results in order to show all electoral districts as equally sized and shaped. However cartograms by their very nature diverge from traditional maps and therefore can be confusing for users.

Data analytics company Jetpack.AI has developed a cartogram of the 2022 U.S. House Elections in which the states keep their geographical integrity and in which electoral districts are also roughly equally sized. The result is a map which is still geographically recognizable and which doesn't visually skew the importance of the largest rural districts at the expense of the geographically smaller but more densely populated districts.

You can discover how Jetpack.AI created their new 'non-contiguous cartogram' election map on A better U.S. house election results map. This tutorial includes an interactive demo map which allows you to switch between the new cartogram map and a traditional map of the 2022 House Election results (as shown in the little GIF above).

The tutorial also includes an explanation of the steps taken to create a map which retains a lot of geographical integrity but still portrays all electoral districts in roughly equal sizes. In brief this involves dividing each state by randomly distributing a large number of points in a state and then clustering these points by the number of electoral districts in the state. The centoids of each of these clusters is then calculated and, finally, a voronoi diagram is created of the state based on the centroid of these electoral districts. The result is a map of the state which is roughly divided into a number of roughly equally sized areas (the number of areas being equal to the number of the House electoral districts in the state).

Saturday, December 10, 2022

3D Conservation Mapping

Iconem is a company which is dedicated to digitizing endangered cultural heritage sites around the world in 3D. The company works with governments and cultural organizations to create photorealistic 3D models of important heritage sites. These models can then be used in preservation efforts and to help promote a heritage site to a wider global audience.

Iconem Exploration showcases some of the 3D models created by Iconem of important global heritage sites. All of the models in this showcase were made by Iconem in partnership with the help of local partners. This showcase allows you to explore the temples of Angkor Wat, the pyramids of Nuri and many other sites around the globe.

Each of the models were captured using drones to capture thousands of aerial images of a site. Using these images Iconem is then able to construct a pointcloud photogrammetery model of the location. Using Iconem Exploration you can use your mouse to navigate around and explore each of the showcased 3D models, and to zoom-in and out on a scene. Each model also includes a number of measuring tools which allow you to measure the height of structures in the 3D model and the distances between important artefacts within a scene.

Friday, December 09, 2022

The Map of Stories

The Map of Stories is a fantastic interactive map which allows you to discover and listen to tales from the highlands and lowlands of Scotland. Using the the you can explore the rich oral storytelling traditions of Scotland and listen to stories born from the landscapes and people of Scotland.

Using the map you can browse over 70 stories by story location or by storyteller location. The map also includes controls which allow you to filter the stories shown by language (English, Gaelic or Scots) and by category.

The stories found on the map come in many forms. Many of the stories emerge from indigenous  communities, traveller communities and from the Shetland Islands. Others come from Scotland's migrant communities, from countries as far away as India and Iran. However, no matter their origin, all the stories can be listened to simply by clicking on its marker on the map.

Sgeulachdan na Mara / Sea Stories - an online cultural map of the sea is a wonderful interactive map featuring local stories found around the island of Barra, in the Outer Hebrides of Scotland.

To create the map the island's school pupils interviewed local Barra fishermen and older members of the local community. The result is a unique map featuring local legends and oral history as told by the islanders themselves. You can watch and listen to the videos and audio recordings resulting from the interviews directly from the Sea Stories map.

The map legend allows you to highlight on the map where audio, video, photographs or text are available to be viewed. These media are shown on the map using a number of different types of marker, indicating stories about wrecks, fishing, coastal features etc.

There is a lot to love about this map, not least the wonderful cartography of the vintage style map of Barra. The real stars of this map, however, must be the islanders of Barra. There are at least two Gaelic folk song recordings on this map which are worth the price of admission (there is none) on theur own.

Wednesday, December 07, 2022

Who is Dreaming of a White Xmas?

If you live in Idaho then you can start dreaming of a white Christmas. According to NOAA's White Christmas interactive map Idahoans have a very good chance of seeing snow on Christmas Day. 

NOAA's White Christmas map uses historical weather data to provide a prediction of the chance of experiencing at least 1 inch of snow at your location on Christmas Day. The whiter the map at your location then the more chance there is of having a white Christmas.

If you want to know when the first snow of the year is most likely to fall where you live then you can refer instead to NOAA's handy interactive First Snow Map, which provides a nationwide guide to when you can expect to get the first snow of the winter. The map shows the date at your location when the chance of snow is at least 50%, based on historical weather records. 

AccuWeather has also released its annual predictions of the chances of seeing snow at Christmas. The AccuWeather White Christmas Forecast 'historical probability' map is calculated on a very similar basis to NOAA's forecast. The AccuWeather map shows the historical probability of a location seeing at least 1 inch of snow on the ground at Christmas based on 30-years worth of weather data.

However AccuWeather also uses this year's weather conditions and forecasts to provide a 2022 White Christmas Map. This map uses medium term weather forecasts to predict which areas of the United States have a higher or lower chance of seeing snow compared to 'normal'. 

The National Fast Food Index

If you buy a MacDonald's Big Mac in Lee, Massachuesetts you will have to pay a whopping $7.89. That is over twice as expensive as buying the very same burger at a MacDonald's in Eufaula, Oklahoma, where a Big Mac costs just £3.39.

The price of a MacDonald's Big Mac in the towns of Lee & Eufaula, and in the other 13,271 MacDonald's outlets in the United States can be explored on the Fast Food Index. The Fast Food Index is an interactive map which compares the differences in the prices of fast food across the United States. The map allows you to compare the prices charged by MacDonald's, Chick-Fil-A, Taco Bell and Chipotle across the whole of the US.

Select one of these four fast food chains and you can view a choropleth map comparing the price of the chain's signature dish at all its outlets across the country. On the map the United States is divided using a voronoi layer based on the nearest fast food outlet. This means that if you zoom in on your home on the map the choropleth layer shows the price at your nearest outlet. If you zoom-in on a fast food outlet you can view the actual price of its signature dish as a label on the map.

According to Statista the average price of a Big Mac in the United States is $5.15. In fact the $7.89 charged for a Big Mac in Lee is more expensive than the average price paid by the residents of Switzerland. Switzerland leads Statista's Big Mac Index. At an average price of $6.71 you will pay more for a Big Mac (on average) in Switzerland than in any other country in the world. According to Statista's analysis the cheapest country to buy a Big Mac is Venezuela, where the average cost of a Big Mac is just $1.76.

Tuesday, December 06, 2022

Mapping Armageddon

Asteroid Launcher is an interactive map which attempts to estimate and visualize the impact and effects of an asteroid hitting the Earth. Using the map it is possible to view the likely impact of various types and sizes of asteroid hitting a location at different speeds and impacts.

To view the predicted impact of an asteroid hitting your home you just need to click on your town on the interactive map. You can then choose a type of asteroid (e.g. iron, stone etc), the diameter of the asteroid, and its speed & angle of impact. Click on 'Launch Asteroid' and you can then view information on the predicted width and depth of the impact crater, and data on the number of people who would be vaporized in the crater, or killed by the resulting fire ball, shock wave and wind blast.

The chances of an asteroid hitting your town within your lifetime are very slim. You are actually far more likely to be destroyed by a nuclear weapon. But don't worry Bomb Blast can tell you the likely effects of a nuclear missile landing on your home.

Outrider's Bomb Blast interactive map allows you to choose from a range of different types of nuclear weapon and whether you want to detonate it at ground level or as an air burst. You can then view the likely damage of the selected weapon hitting your town visualized on an interactive map. The map shows the likely radius of the fireball, radiation, shock-wave and heat. It also provides an estimate of the number of fatalities and injuries that your nuclear weapon would cause to your chosen target.

Monday, December 05, 2022

How Well Do You Know Your Neighborhood?

The New York Times is running an interesting geographical survey asking New Yorkers to draw the border of their local neighborhood. In an attempt to "create a reader-sourced map" of New York neighborhoods the NYT ask their readers where they live in NYC and then to draw the outline of that neighborhood on an interactive map.

To participate in Help Us Map New York's City's Neighborhoods you just need to center the interactive map on your home (the map bounds is restricted to New York City). You are then asked to give the name of your neighborhood and enter how many years you have lived at that address. Then, by simply clicking on the map, you are asked to draw a line around your neighborhood.

The New York Times are not the first organisation to survey local knowledge about local boundaries using an interactive map. In fact a few years ago DNA Info ran a very similar survey asking their readers to draw the boundaries of New York neighborhoods. In September of this year Axios also asked its readers to draw the outline of their local neighborhood on an interactive map.
In Axios' Draw Your Neighborhood you are asked to draw an outline on a map to show where you think your neighborhood boundary lies. Once you have drawn the boundaries for a few of your city's neighborhoods you can compare how well your local knowledge compares to other Axios readers. 

There are twenty U.S. cities to play in Axios' Draw Your Neighborhood, including San Francisco, Philadelphia, Dallas and Chicago (but not NYC). After you select a city you are then asked to draw on an interactive map the boundaries of five city neighborhoods. When you have drawn all five you can view a map showing the average boundary for each neighborhood (as drawn by other players) and are given a percentage score for each neighorhood indicating how different your guess was from the average.

It is actually very easy to create your own map survey. Two years ago I created my own map survey Where is Texas, which asked people to draw the border of a whole state. You can clone my map to create your own map survey for any location on Earth (just click on the fish logo on the map and select 'Remix on Glitch' to create your own editable instance of the map).  

If you are interested in the results of my map survey then take a look at Here is Texas. This map shows all the entries submitted to my Where is Texas map survey. The real border of Texas is also shown as a white polygon on the map.

Friday, December 02, 2022

The World's Largest Polluters

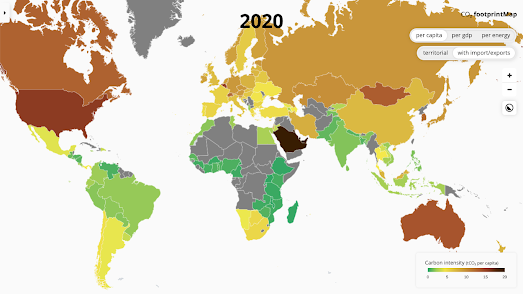
The footprintMap is an interactive mapped visualization of the CO2 footprint of 118 countries around the world. Using the map you can discover the per capita CO2 output of each country and see which countries contribute the most and least to global heating. 

According to this map Singapore has the highest per capita CO2 footprint of any country. The United States has the 9th highest per capita CO2 footprint of the 118 countries featured on the map. Malawi, Uganda and Rwanda (respectively) have the lowest per capita CO2 footprint of the 118 countries. 

The carbon data for the map comes from the BP Statistical Review of World Energy 2022 and the Global Carbon Budget 2022. The population and GDP used on the map is derived from the Worldbank.

The footprintMap was created by Electricity Maps. Electricity Maps is a real-time map of electricity production around the world. The map uses data about electricity production and consumption from energy producers and government agencies across the globe to provide a near real-time dashboard of the live CO2 emissions and electricity consumption of individual states and countries. 

Each country and state on the live map is colored by how much CO2 is used to produce its electricity demand. If you hover over a country or state on the map you can view the percentage of its electricity which is low carbon or from renewable sources. If you click on a country or state then you can view a breakdown of how its electricity demand is met. For example, how much electricity is produced by wind, solar or hydro power plants.

Thursday, December 01, 2022

How Rising Seas May Impact Your Home

Coastline Paradox uses Google Maps Street View imagery to visualize how rising sea levels are likely to affect locations around the world over the next three hundred years. The map was created by Finnish artists Pekka Niittyvirta and Timo Aho to provide a powerful visualiztion of likely sea level rises and their effects on global migration.

Using Coastline Paradox it is possible to view the likely effects of rising sea levels at locations around the world for any year between now and 2300. Select one of the global locations marked on the map with a blue dot and a panoramic Street View image will appear. Superimposed on top of this image is a glowing white line which shows the likely future sea level at that location. You can adjust the date for the sea level prediction at any location by using the timeline control above the map.

A text box is also superimposed on top of the Street View image informing you of the year displayed, the number of feet that the sea will have risen by that date and the number of people who will likely have been displaced at the selected location by the rising sea level. The sea level rises displayed on the map are based on the Intergovernmental Panel on Climate Change’s (IPCC) Special Report on the Ocean and Cryosphere in a Changing Climate (2019).

It is possible to make a sea level rise visualization a little more realistic by using AI to add a little water to a Street View image. Foe example, the picture above shows how the Louvre art gallery might appear after global sea level rises have flooded Paris. This imagined view of the Louvre was created by ThisClimateDoesNotExit.

ThisClimateDoesNotExist is a clever Google Street View based application which allows you to see how your house might look after your street has flooded. To create an imagined view of your flooded house you just need to type your address into ThisClimateDoesNotExist's Google Map. If Google Street View imagery is available at this address you can then view an 'AI' generated image of your home under a few feet of water.

ThisClimateDoesNotExist claims to be "an AI-driven experience based on empathy". What this means is that the application does not use any real rising sea level predictions to picture your house under water. It just portrays an imagined scenario. As long as the user is clear that the enhanced Street View image isn't based on any real climate change science then the generated picture of an address can have a strong emotional impact. Nobody wants to really see their home flooded by rising waters.

I suspect that both Coastline Paradox and ThisClimateDoesNotExist have used the GSVPanoDepth Street View depth library to visualise sea level rise in such a powerful way.

Almost 20% of Singapore is reclaimed land. The country is therefore very worried about the likely effects of rising sea levels. In order to illustrate the possible impact of sea level rise the Straits Times has created a virtual reality visualization called Singapore Underwater. 

Singapore Underwater uses virtual reality to show how Singapore might look in the future if global warming leads to rising sea levels. Singapore Underwater explains the reasons why sea levels are rising around the world. The visualization also looks at how Singapore might try to mitigate against rising seas and the possible impact of land loss and saltwater contamination of the country's farmland & reservoirs. 

Singapore Underwater is best viewed with a VR headset but it can be viewed on a desktop, tablet or mobile device.

The recent devastating floods in Pakistan and Australia have obviously led many people to wonder about how susceptible their homes are to flooding. One consequence of global heating and rising sea levels is that flood risks are increasing across the world and these kind of lethal floods are going to become much more common. 

Climate Risk's Coastal Risk Map allows you to view your risk from projected sea level rise and coastal flooding by year, water level, and by elevation.Share your location with the Coastal Risk Map and you can view the potential flood risk for different years and for different levels of sea level rise. 

Wednesday, November 30, 2022

England is No Longer a Christian Country

New data from the 2021 UK census shows that for the first time less than half of the people of England & Wales identify as Christians. In last year's census 5.5 million fewer people described themselves as Christian than in 2011.

The Church of England plays an integral role in UK life. 27 bishops are automatically given seats in the House of Lords (the upper house of the UK parliament) and schools in the country are required to teach and worship the Christian religion. The new census data has led to renewed calls for the disestablishment of the Church of England, to end its status as the official church of the UK.

You can explore support for the Christian religion and the support for other religions on the Office for National Statistics Census Mapper. This interactive choropleth map allows you to view the percentage of people who identify with the Christian, Muslim, Jewish, Buddhist, Hindu, or Sikh religions, or who identify as non-religious. 

One interesting pattern revealed by the map is that inner-city census tracts seem to have fewer Christians than suburban and rural areas. This doesn't mean that these areas necessarily have more people identifying as non-religious. The drop in the percentage of people identifying as 'Christian' in inner-city areas appears to be because these areas are more ethnically diverse. In other words more people in these areas identify with non-Christian religions.

Across England & Wales 37.2% of the population said they had no religion. 46.2% of people said that they were Christian. On current trends by the time of the next census in a decade's time there will be more non-religious people than Christians in England & Wales. 

If you select 'No religion' on the ONS map you can view the areas of England & Wales where the majority of the population already identifies as non-religious. South Wales in particular has a cluster of census tracts where the majority of the people have no religion. Norwich and Brighton and Hove also stand out as cities where over half the population identify as non-religious. Interestingly both Norwich and Brighton & Hove have a relatively high percentage of White residents, compared to other cities in England & Wales. This may suggest that there is a higher percentage of people identifying as non-religious in the White population than there is in other ethnic groups.

Tuesday, November 29, 2022

Explore Inside the Pyramid of Giza

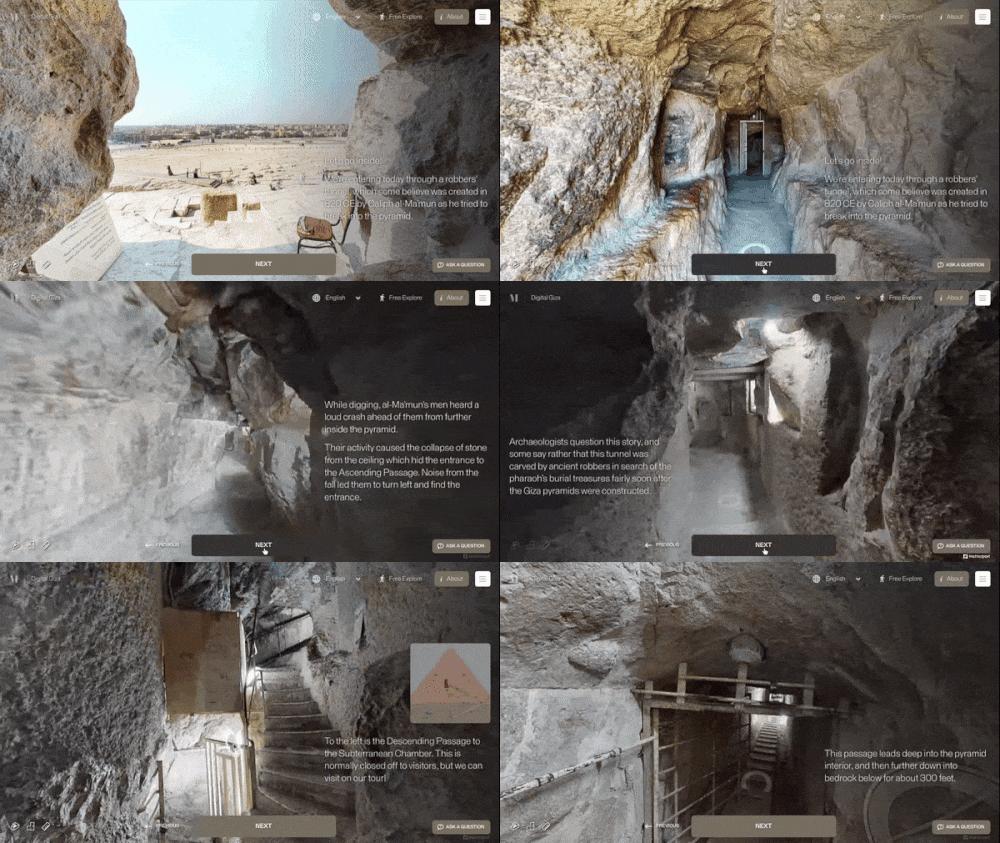
Go Inside the Great Pyramid of Giza is an amazing virtual 'Street View' tour of the normally closed inner chambers of the Khufu Pyramid in Egypt. This guided tour allows you to explore the interior three chambers of the pyramid, including the King's Chamber, the Queen's Chamber and the subterranean chamber, which is cut into and decends into the bedrock below the pyramid itself.

The Khufu Pyramid or Great Pyramid of Giza is the largest of the Egyptian pyramids and is the tomb of the pharaoh Khufu, who died in 2566 BC.The Great Pyramid was the world's tallest building for more than 3,800 years. Very few people are allowed inside the Great Pyramid of Giza. Today you are one of them.

The tour enters the pyramid via a robber's tunnel believed to date back to 820 BC. At the entrance of this tunnel you have two choices. You can either take the Guided Tour or use the Free Explore option. The guided tour uses custom made 360 degree panoramic 'Street View' imagery to lead you inside the pyramid and into the three chambers. This guided tour includes contextual annotations which explain what you are seeing during the tour. The 'Free Explore' option allows you to enter and explore the pyramid alone. In this mode you are left to your own devices to use the navigation circles added to the panoramic imagery to virtually explore inside the Great Pyramid. 

Monday, November 28, 2022

Do You Live in A Disadvantaged Neighborhood?

A new interactive map identifies neighborhoods in the USA which are "considered disadvantaged communities". The Climate and Economic Justice Tool was developed by the Council on Environmental Quality in order to help the government meet the Justice40 initiative, under which federal funds should be targeted at communities which are "overburdened by pollution and historic underinvestment."

If you enter your address or zip-code into the map you can discover if your census tract is designated disadvantaged or not. You can also view a host of data which reveal how your census tract ranks in comparison to other areas using a number of socio-economic and environmental metrics. 

The map identifies 27,251 census tracts in the U.S. as disadvantaged or partially disadvantaged. A tract can be identified as disadvantaged if it is seen to have a 'burden' related to climate change, poor transportation, legacy pollution AND where average household income is less than or equal to twice the federal poverty level.

Thursday, November 24, 2022

The Future of Forests

Climate change is already leading to temperature changes in biomes, and effecting the development of the species which depend on them. As a result of global heating and increased temperatures the natural habitats of forest tree species are beginning to change. According to Appsilon (creators of R Shiny dashboards) predicted "climatic changes will significantly affect living conditions for trees. Increased temperatures and decreased precipitation during the growing season will affect particular tree species differently."

In order to show how climate change will affect individual tree species Appsilon has released Future Forests, an interactive map which visualizes the current range of a number of tree species and predicts their future ranges under three different climate change models. If you choose a species of tree from the map's drop-down menu and a climate change scenario (optimistic, moderate or pessimistic) you can see the tree species' current range and its predicted range in 70 years time. 

For example, the map above shows in red where the Douglas fir will stop growing in Europe under a pessimistic climate change scenario. Under this scenario the Douglas fir's habitat will move dramatically. The map shows in blue the areas where the Douglas fir is predicted to start growing outside its current habitat under this pessimistic climate change model.

The map allows you to view the predicted habitats of 12 different tree species which currently grow in European forests. 

Wednesday, November 23, 2022

The lutruwita place names map

pulingina to lutruwita (Tasmania) Place Names Map is an interactive map which shows the original palawa kani names for lots of locations in lutruwita (Tasmania). palawa kani is the language of Tasmanian Aborigines. The map was created by the Tasmanian Aboriginal Centre using research undertaken by the palawa kani Language Program.

According to the Tasmanian Aboriginal Centre only "a handful of places in lutruwita still bear their original names". These handful of palawa kani place names are also given using English spellings, which do not convey the original sounds. The pulingina to lutruwita Place Names Map includes audio recordings of each place name spoken by a palawa kani speaker. Click on a place name's marker on the map and you can also learn a little about the history of the name.

You can learn more about the map and the palawa kani Language Program on the Tasmanian Aboriginal Centre website.

You may also be interested in:

  • New Zealand - the Te Reo Māori Web Map shows the Te Reo place-names of New Zealand towns, cities, lakes, rivers, mountains and other notable locations.
  • Australia - The Land is a Map shows locations in Australia with names of Indigenous Australian origin. Click a place name marker on the map to learn more about a place name's etymology from its Wikipedia entry.