How to Turn Interactive Maps into Vector Graphics
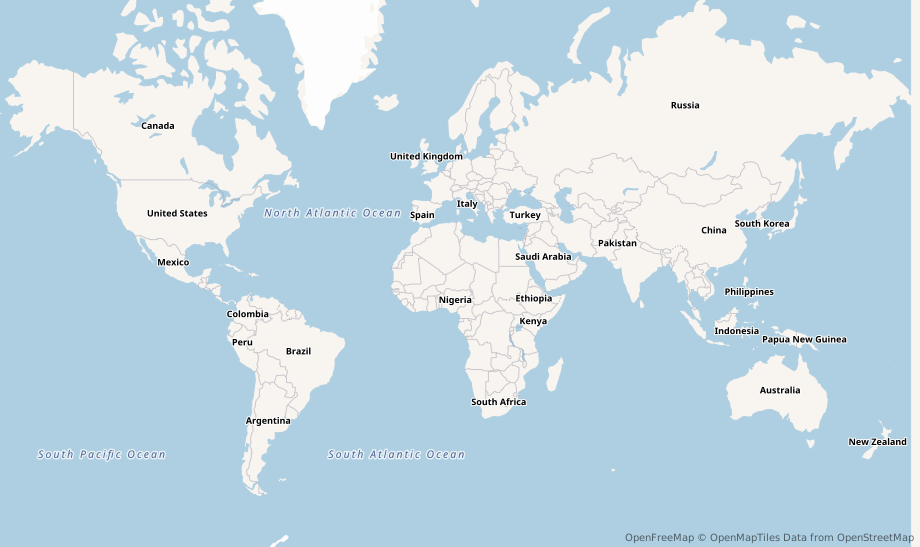
This world map may look like an interactive map but it is actually an image. It is an SVG map of the world that I created in a couple of seconds using Polygrid Map2SVG.
One of the great advantages of vector graphics is that they can be scaled to any size without losing quality. Whether you're designing a poster, preparing artwork for print, or producing illustrations for the web, SVG is often the ideal format. The new Map2SVG tool makes creating SVG maps remarkably straightforward.
Map2SVG is an interactive web application built on MapLibre that lets you select any area on a map and export it as a layered SVG file. Simply navigate to the location you want, draw either a rectangle or a custom polygon around the area of interest, and click Export.
What makes Map2SVG particularly useful is the amount of control it gives you over the exported map. Rather than generating a single flat image, it preserves the map as editable vector artwork. Roads, buildings, water, parks, labels and boundaries remain separate vector elements, making it easy to refine the map later in applications such as Adobe Illustrator or Inkscape.
The application also lets you decide exactly which features should appear in the final output. Before exporting, you can toggle entire categories of map data, including:
- Roads (with separate controls for motorways, primary roads, secondary roads and tracks)
- Buildings
- Water and oceans
- Parks and natural features
- Land use
- Railways
- Administrative boundaries
- Labels (cities, towns, POIs, street names and more)
This makes it possible to create highly customised maps for very different purposes.
The tool also supports multiple map styles, including several OpenFreeMap basemaps, and even allows users to add their own custom MapLibre style URLs.
The remaining teams in the World Cup
If your goal is data visualization rather than graphic design, another excellent browser-based tool to consider is Google’s GeoChart. While Map2SVG is designed to export highly detailed physical geography - like roads, buildings, and land use - into layered vector artwork for print or illustration, GeoChart serves a completely different purpose. It is a macro-level dashboard tool built specifically for displaying spatial data distribution at a glance. GeoChart takes structured datasets (like sales figures, population metrics, or regional trends) and automatically converts them into clean, interactive choropleth maps or marker plots.
You would choose GeoChart over Map2SVG when your primary objective is to tell a story with data rather than map out a physical environment. For instance, if you need to build an interactive dashboard showing global website traffic by country, regional sales performance across US states, or specific city coordinates scaled by population density, GeoChart handles the heavy lifting instantly using JavaScript or Google Sheets.
Note: GeoChart uses standard ISO country codes. Therefore I was unable to map England in the image above. To get the map to render, I had to change England to "United Kingdom" (or "GB"), which means the map automatically highlights the entire UK, including Scotland, Wales, and Northern Ireland.


Comments