
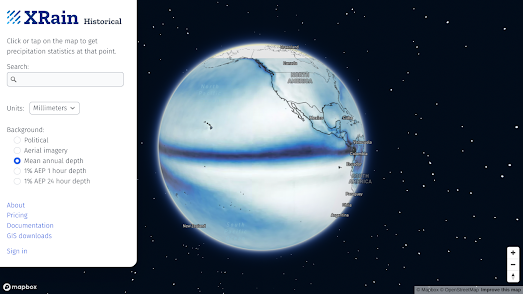
X-Rain is an interactive map which visualizes the average amount of rainfall around the globe. The precipitation data used on the map is derived from historical satellite observations. This remote sensed data is not as accurate as data recorded by rain gauges but it is able to provide a more global view of precipitation levels as it is not limited to only those locations with rain gauges.
The X-Rain map provides a very clear visualization of the ring of rain around the Earth's equator. Areas near the equator receive higher levels of rainfall due to convectional rainfall. Because the equator is located in the tropical region where the sun is most direct and intense it can receive more rain than other latitudes. The intense heat of the sun at the equator causes warm, moist air to rise rapidly, resulting in convectional uplift. As the air rises, it cools, condenses, and forms clouds. This process leads to heavy precipitation and frequent rainfall in equatorial regions.
NASA's Earth Observatory has created an animated map of annual Total Rainfall. This map shows total monthly rainfall using data from NASA’s Integrated Multi-satellitE Retrievals for GPM (IMERG). Again you can see that most areas near the equator receive above average levels of precipitation, due to convectional rainfall.
NASA's animated map of monthly rainfall totals also does a great job of visualizing the seasonal patterns in precipitation. According to NASA "about two-thirds of all rain falls along or near the equator, and countries in those latitudes often have several months of near-daily rain followed by months of dryness as the rain band moves north and south." These seasonal changes are why many parts of Asia experience monsoon conditions between April and September and South America experiences a rainy season from October to May.
No comments:
Post a Comment