The Cycling Stress Map
Earlier this month I reviewed the City of Boston's Bicycle Level of Traffic Stress interactive map. A map which rates every road in the American city based on the stress caused to cyclists from road traffic, the lack of bike lanes and other conflict factors. The Bici Stressat ed al Traffico interactive map is a little more ambitious, in that it has mapped the cycling stress levels on every single road in Italy.
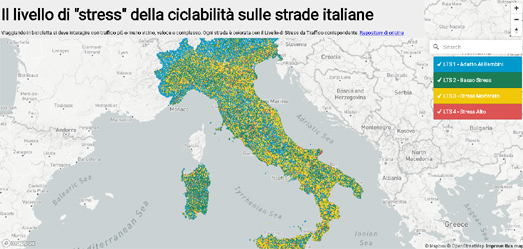
The Bici Stressat ed al Traffico is an interactive map which rates and colors every Italian road based on the stress caused to cyclists from other road traffic and from the availability of cycling infrastructure. Every road on the map is given one of four ratings: 'Safe for Children', 'Low Stress', 'Moderate Stress' or 'High Stress'. Cyclists can use the interactive map legend to turn on or off the roads of different stress levels. So, for example, if you wanted to plan a pleasant bike ride you could just select to view all the roads rated Safe for Children or Low Stress.
The four different cycling stress ratings given to individual roads are based on both the levels of road traffic and the presence / absence of separated bike lanes. You can learn more about how each of the four ratings are defined on the BikeItaly GitHub page (in Italian). These ratings are apparently based on ratings defined by Bike Ottawa.


Comments